Les chiffres du marathon de Chicago 2015
Le marathon de Chicago 2015 a attiré 45 000 coureurs à Chicago le 11 octobre 2015. Plus de 37 000 d'entre eux ont terminé la course, et les détails des performances de chaque coureur ont été soigneusement enregistrés. Explorez et visualisez les caractéristiques des coureurs et leurs performances à l'aide d'un magasin d'entités personnalisé contenant ces données.
Chargez un magasin d'entités du marathon à partir d'un ResourceObject.
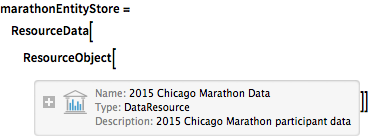
marathonEntityStore = ResourceData[
ResourceObject[
Association[
   "Name" -> "2015 Chicago Marathon Data",
    "UUID" -> "7dc77972-cfc3-48dc-8d08-0292c6d2a929",
    "ResourceType" -> "DataResource", "Version" -> "1.0.0",
    "Description" -> "2015 Chicago Marathon participant data",
    "ContentSize" -> Quantity[1990.2215919999999`, "Megabytes"],
    "ContentElements" -> {"Content"}]]]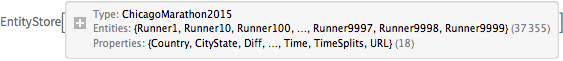
Enregistrez le magasin pour cette session.
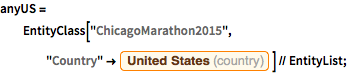
PrependTo[$EntityStores, marathonEntityStore];Extrayez le nombre total de coureurs et, à l'aide d'une classe d'entités définie implicitement, le nombre de participants masculins et féminins.
EntityValue["ChicagoMarathon2015", "EntityCount"]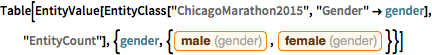
Table[EntityValue[
  EntityClass["ChicagoMarathon2015", "Gender" -> gender],
  "EntityCount"], {gender, {Entity["Gender", "Male"],
Entity["Gender", "Female"]}}]Sélectionnez cinq coureurs au hasard.
RandomEntity["ChicagoMarathon2015", 5]Affichez les propriétés stockées pour un coureur particulier.
Entity["ChicagoMarathon2015", "Runner145"]["PropertyAssociation"]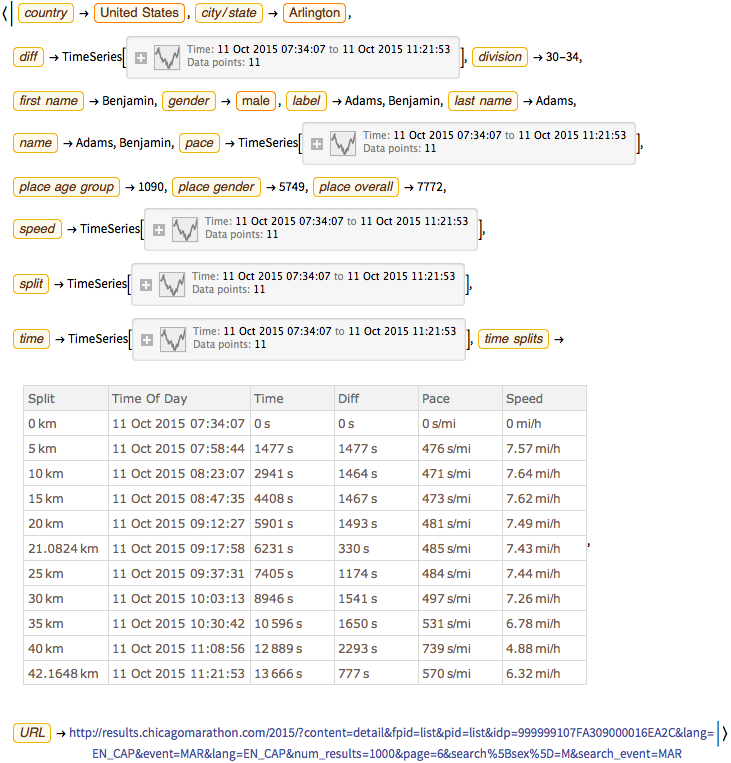
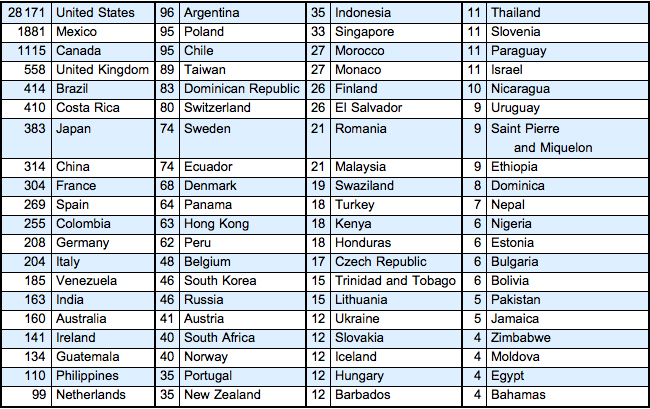
Extrayez les totaux des nationalités des coureurs et créez un tableau des nationalités les plus courantes.
nationalityTallies =
  Reverse[SortBy[
    Tally[EntityValue["ChicagoMarathon2015",
      EntityProperty["ChicagoMarathon2015", "Country"]]], Last]];
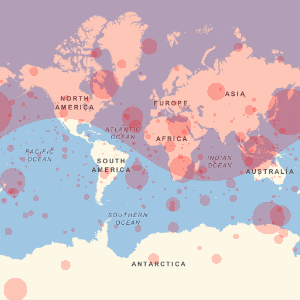
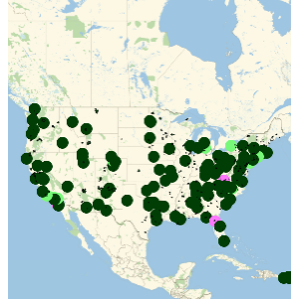
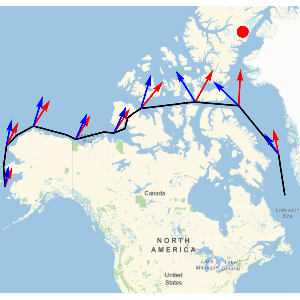
Visualisez les trajectoires géodésiques de tous les pays d'origine jusqu'à Chicago.
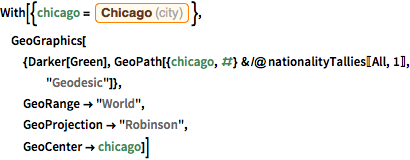
With[{chicago =
   Entity["City", {"Chicago", "Illinois", "UnitedStates"}]},
 GeoGraphics[{Darker[Green],
   GeoPath[{chicago, #} & /@ nationalityTallies[[All, 1]],
    "Geodesic"]},
  GeoRange -> "World",
  GeoProjection -> "Robinson",
  GeoCenter -> chicago]]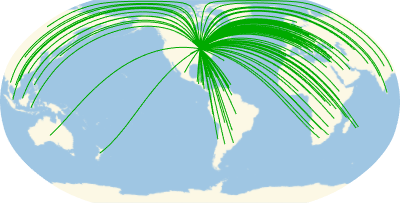
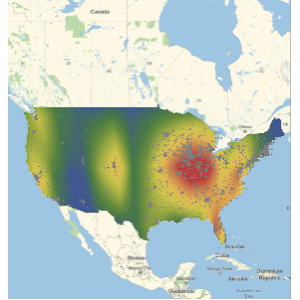
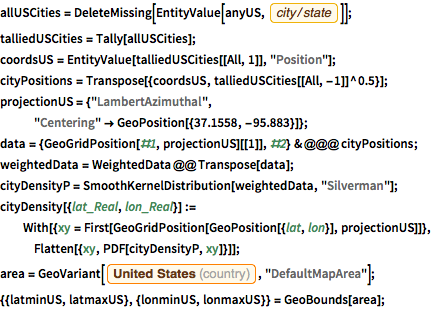
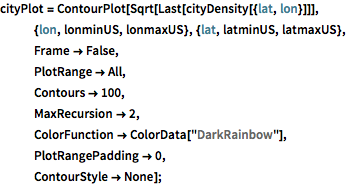
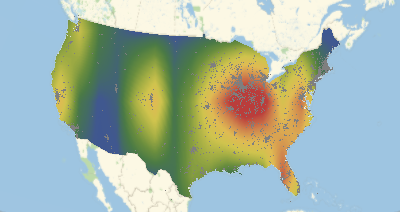
Créez une carte thermique des États-Unis montrant les lieux d'origine des participants américains.
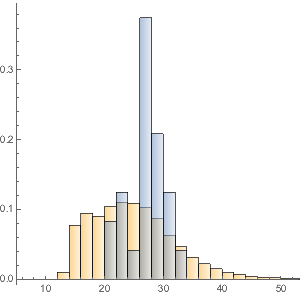
Trouvez le nombre de coureurs par variation par rapport à la moyenne.
allkm = Table[
   Normal[allTimeSplits[[i]][2 ;;, "Time"]], {i,
Length[allTimeSplits]}];allsplitbins = DeleteMissing[Transpose[allkm], 2];meanall = Table[N[Mean[allsplitbins[[i]]]], {i, Length[allsplitbins]}]marathondistances = (allTimeSplits[[1]])[All, "Split"] // Normal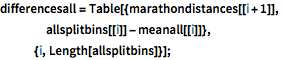
differencesall = Table[{marathondistances[[i + 1]],
    allsplitbins[[i]] - meanall[[i]]},
   {i, Length[allsplitbins]}];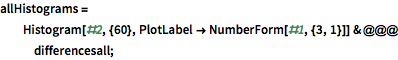
allHistograms =
  Histogram[#2, {60}, PlotLabel -> NumberForm[#1, {3, 1}]] & @@@
   differencesall;
Créez des histogrammes pour chaque division.
Grid[Partition[allHistograms, UpTo[3]]]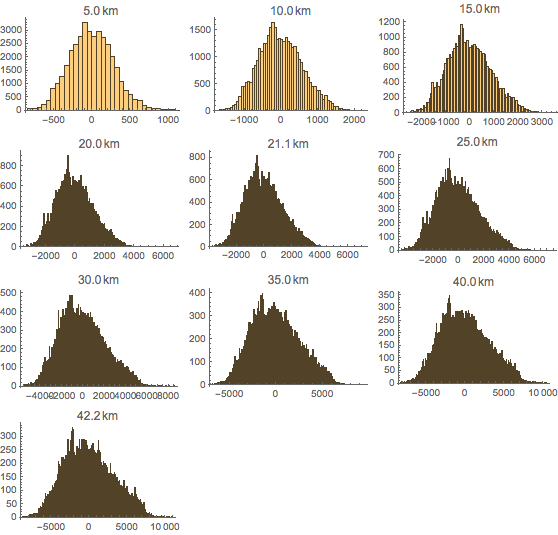
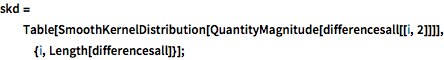
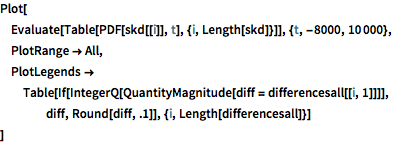
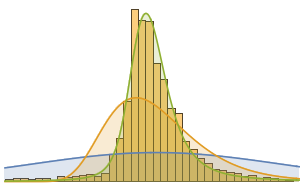
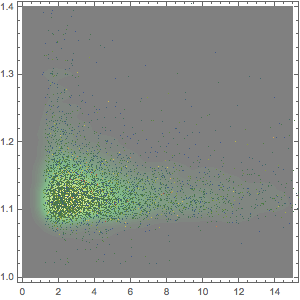
Tracez une distribution à noyau lisse des différences entre les écarts et les moyennes des coureurs.