2015년 시카고 마라톤의 수 실행
2015년 10월 11일 개최된 2015 시카고 마라톤에는 45,000명의 경주자가 모였습니다. 37,000명 이상이 마라톤을 완주하였으며 모든 경주자의 퍼포먼스에 대한 자세한 내용이 신중하게 기록되었습니다. 여기서는 이 데이터를 포함하는 사용자 정의 엔티티 스토어를 사용하여 경주자와 그들의 퍼포먼스 특징을 조사하고 시각화합니다.
ResourceObject에서 마라톤 엔티티 스토어를 로드합니다.
In[1]:=
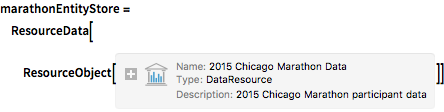
marathonEntityStore = ResourceData[
ResourceObject[
Association[
   "Name" -> "2015 Chicago Marathon Data",
    "UUID" -> "7dc77972-cfc3-48dc-8d08-0292c6d2a929",
    "ResourceType" -> "DataResource", "Version" -> "1.0.0",
    "Description" -> "2015 Chicago Marathon participant data",
    "ContentSize" -> Quantity[1990.2215919999999`, "Megabytes"],
    "ContentElements" -> {"Content"}]]]
Out[1]=
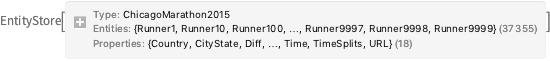
이 세션의 사용을 위해 스토어를 등록합니다.
In[2]:=
PrependTo[$EntityStores, marathonEntityStore];총 경주자 수와 간접적으로 정의된 엔티티 클래스를 사용하여 남성과 여성의 인원수를 알아냅니다.
In[3]:=
EntityValue["ChicagoMarathon2015", "EntityCount"]Out[3]=
In[4]:=
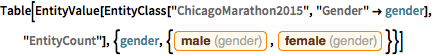
Table[EntityValue[
  EntityClass["ChicagoMarathon2015", "Gender" -> gender],
  "EntityCount"], {gender, {Entity["Gender", "Male"],
   Entity["Gender", "Female"]}}]
Out[4]=
다섯명의 선수를 무작위로 선택합니다.
In[5]:=
RandomEntity["ChicagoMarathon2015", 5]Out[5]=
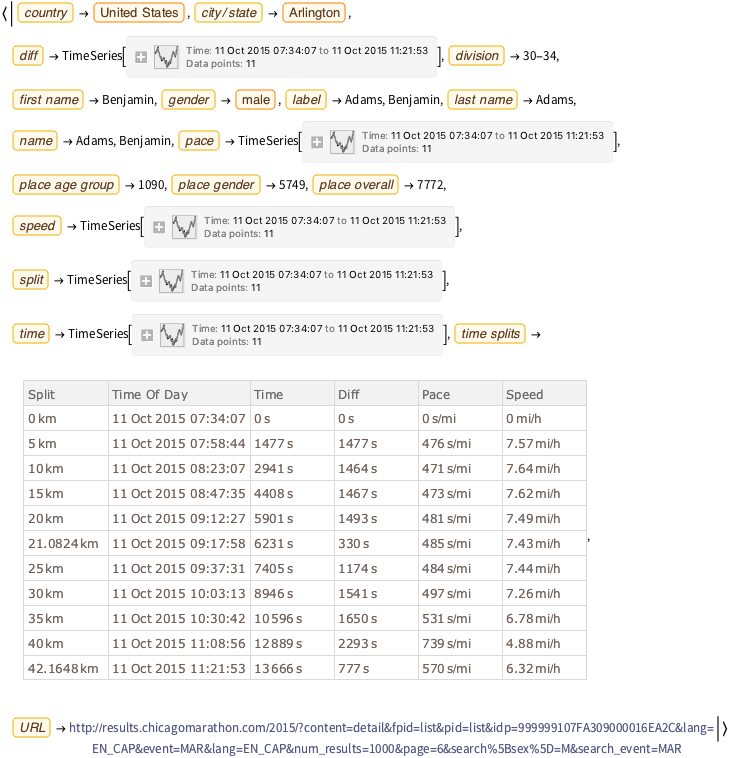
특정 선수에 대해 저장된 특성을 알아봅니다.
In[6]:=
Entity["ChicagoMarathon2015", "Runner145"]["PropertyAssociation"]Out[6]=
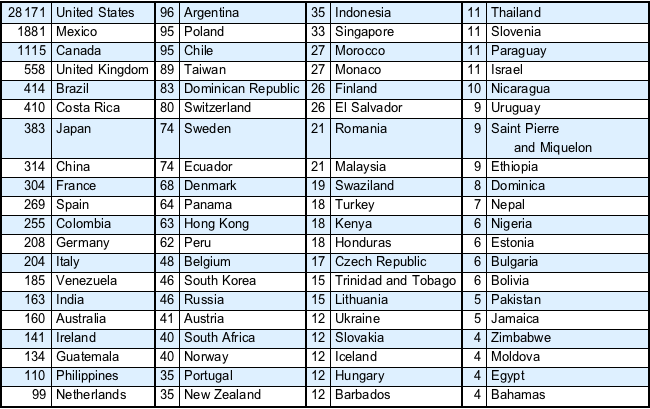
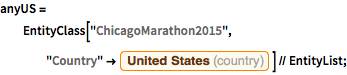
선수 국적의 합계를 추출하고 참가 선수가 많은 국가의 표를 작성합니다.
In[7]:=
nationalityTallies =
  Reverse[SortBy[
    Tally[EntityValue["ChicagoMarathon2015",
      EntityProperty["ChicagoMarathon2015", "Country"]]], Last]];
전체 Wolfram 언어 입력 표시하기
Out[8]//TraditionalForm=
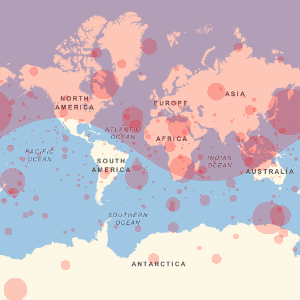
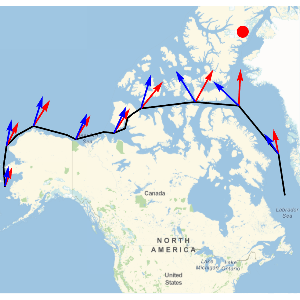
전체 경주자들의 출신국에서 시카고까지의 측지 경로를 시각화합니다.
In[9]:=
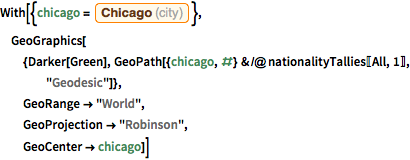
With[{chicago =
   Entity["City", {"Chicago", "Illinois", "UnitedStates"}]},
 GeoGraphics[{Darker[Green],
   GeoPath[{chicago, #} & /@ nationalityTallies[[All, 1]],
    "Geodesic"]},
  GeoRange -> "World",
  GeoProjection -> "Robinson",
  GeoCenter -> chicago]]
Out[9]=

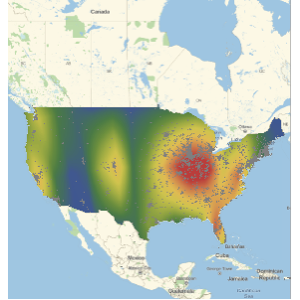
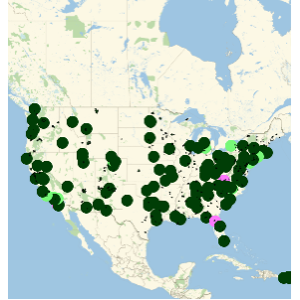
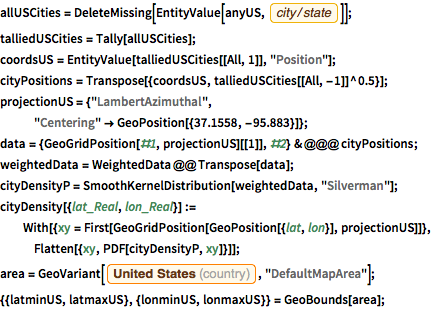
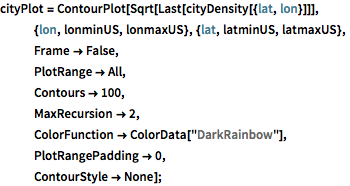
미국 국적 참가자의 출신지를 나타내는 미국의 히트 맵을 작성합니다.
전체 Wolfram 언어 입력 표시하기
Out[12]=

분할 평균에서 변동 당 경주자의 수를 구합니다.
In[13]:=
allkm = Table[
   Normal[allTimeSplits[[i]][2 ;;, "Time"]], {i,
    Length[allTimeSplits]}];
In[13]:=
allsplitbins = DeleteMissing[Transpose[allkm], 2];In[13]:=
meanall = Table[N[Mean[allsplitbins[[i]]]], {i, Length[allsplitbins]}]Out[13]=
In[13]:=
marathondistances = (allTimeSplits[[1]])[All, "Split"] // NormalOut[13]=
In[13]:=
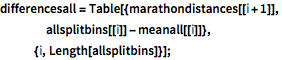
differencesall = Table[{marathondistances[[i + 1]],
    allsplitbins[[i]] - meanall[[i]]},
   {i, Length[allsplitbins]}];
In[13]:=
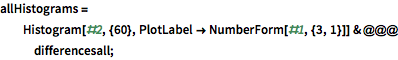
allHistograms =
Histogram[#2, {60}, PlotLabel -> NumberForm[#1, {3, 1}]] & @@@
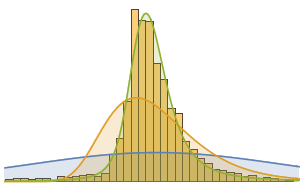
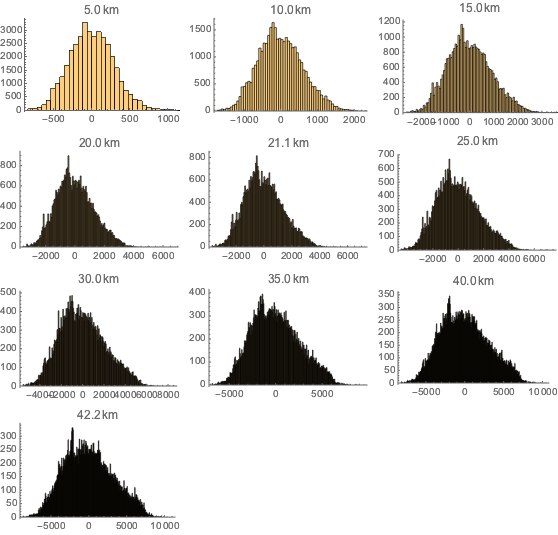
differencesall;각 분할에 대한 히스토그램을 생성합니다.
In[14]:=
Grid[Partition[allHistograms, UpTo[3]]]Out[15]=
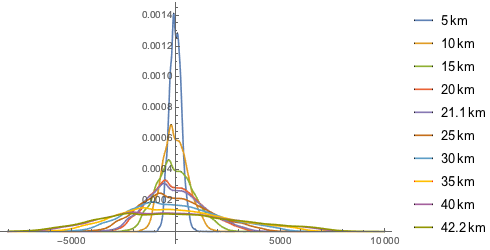
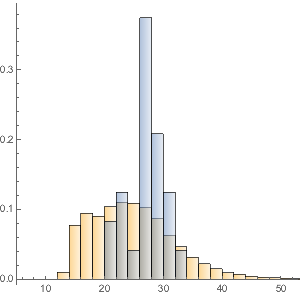
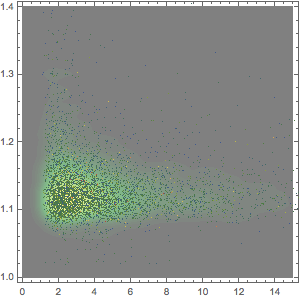
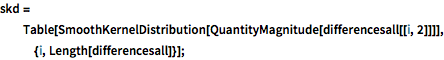
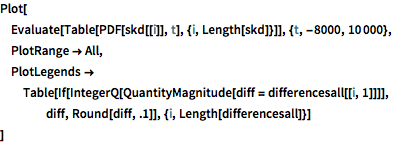
주자의 분할과 평균 간 차이의 평활화 커널 분포를 플롯합니다.
전체 Wolfram 언어 입력 표시하기
Out[17]=