Análisis de los números de la Maratón de Chicago del 2015
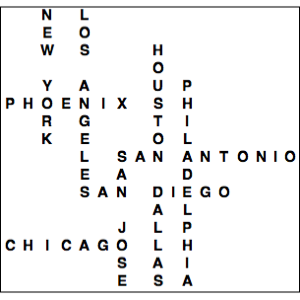
La Maratón de Chicago del 11 de octubre de 2015 contó con 45.000 corredores. Más de 37.000 completaron la carrera, y los detalles del rendimiento de cada corredor fueron registrados cuidadosamente. Explore y visualice las características de los corredores y su rendimiento usando un almacén de entidades personalizado que contenga estos datos.
Cargue un almacén de entidades de la maratón desde un ResourceObject.
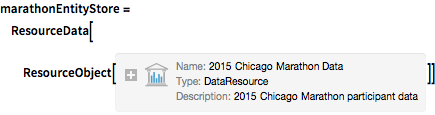
marathonEntityStore = ResourceData[
ResourceObject[
Association[
   "Name" -> "2015 Chicago Marathon Data",
    "UUID" -> "7dc77972-cfc3-48dc-8d08-0292c6d2a929",
    "ResourceType" -> "DataResource", "Version" -> "1.0.0",
    "Description" -> "2015 Chicago Marathon participant data",
    "ContentSize" -> Quantity[1990.2215919999999`, "Megabytes"],
    "ContentElements" -> {"Content"}]]]
Registre el almacén para esta sesión.
PrependTo[$EntityStores, marathonEntityStore];Extraiga el número total de corredores y, usando una clase de entidades implícitamente definida, extraiga el número de participantes femeninos y masculinos.
EntityValue["ChicagoMarathon2015", "EntityCount"]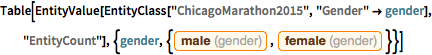
Table[EntityValue[
  EntityClass["ChicagoMarathon2015", "Gender" -> gender],
  "EntityCount"], {gender, {Entity["Gender", "Male"],
Entity["Gender", "Female"]}}]Seleccione cinco corredores al azar.
RandomEntity["ChicagoMarathon2015", 5]Vea las propiedades almacenadas de un corredor en particular.
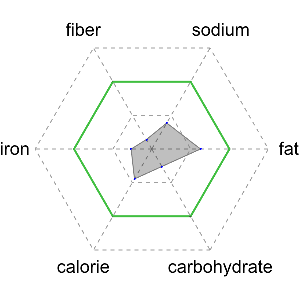
Entity["ChicagoMarathon2015", "Runner145"]["PropertyAssociation"]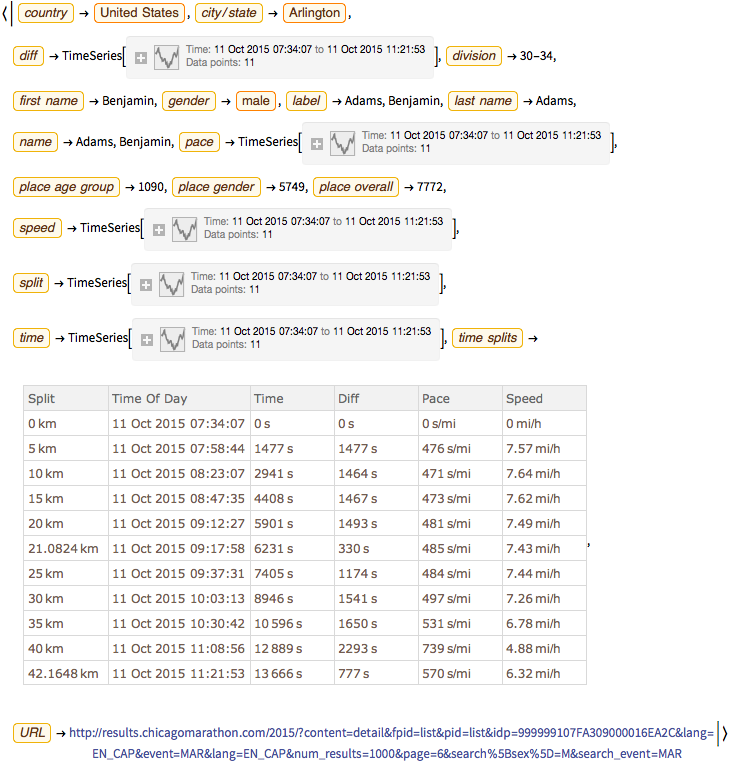
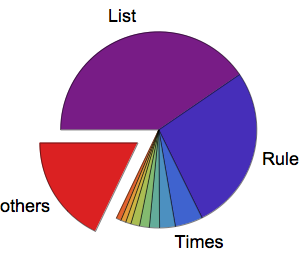
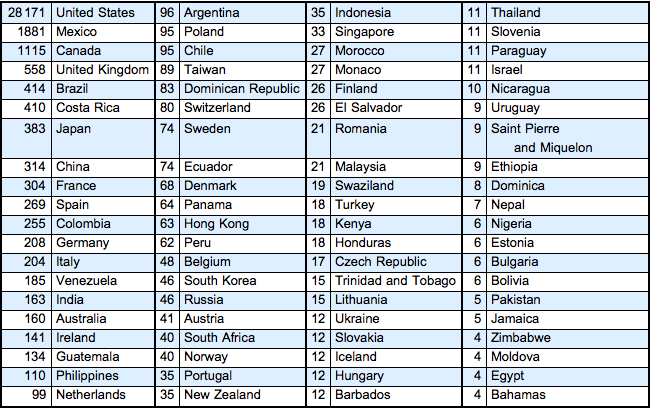
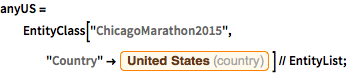
Extraiga la contabilidad de las nacionalidades de los corredores y cree una tabla con las nacionalidades más comunes.
nationalityTallies =
  Reverse[SortBy[
    Tally[EntityValue["ChicagoMarathon2015",
      EntityProperty["ChicagoMarathon2015", "Country"]]], Last]];
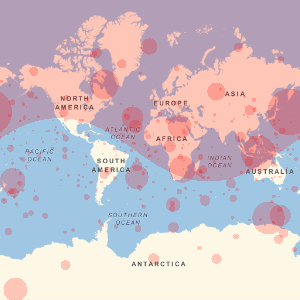
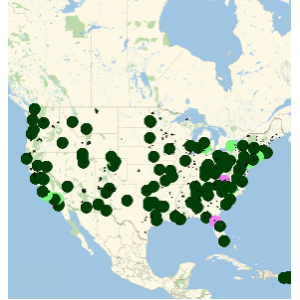
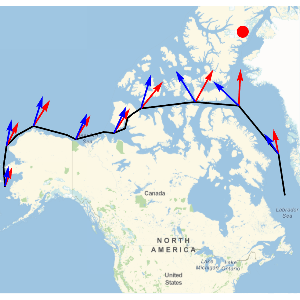
Visualice las rutas geodésicas de todos los países de origen hasta Chicago.
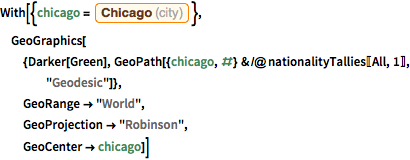
With[{chicago =
   Entity["City", {"Chicago", "Illinois", "UnitedStates"}]},
 GeoGraphics[{Darker[Green],
   GeoPath[{chicago, #} & /@ nationalityTallies[[All, 1]],
    "Geodesic"]},
  GeoRange -> "World",
  GeoProjection -> "Robinson",
  GeoCenter -> chicago]]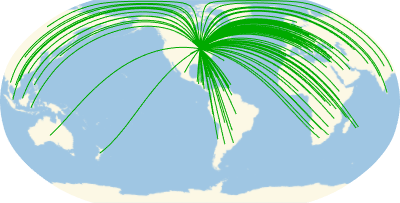
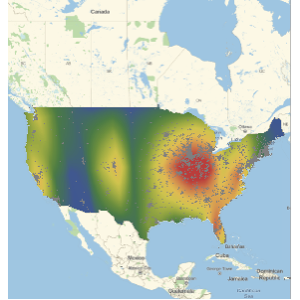
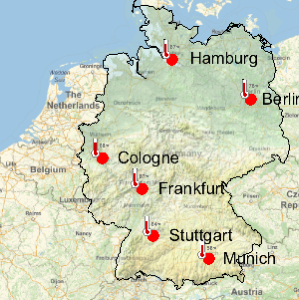
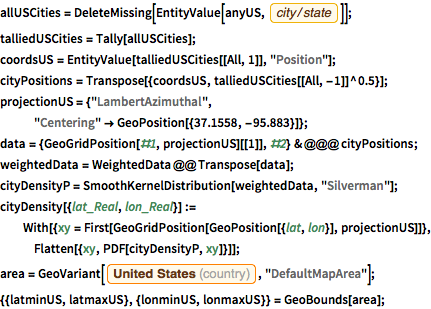
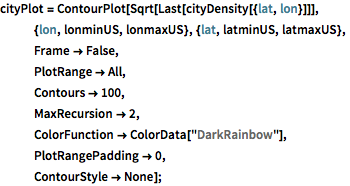
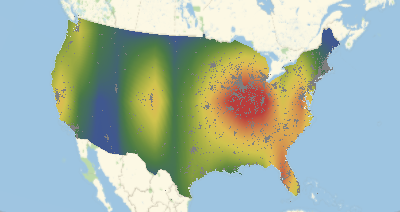
Construya un mapa de calor de los EE.UU. que muestre las ubicaciones de los participantes estadounidenses.
Encuentre los números de los corredores por la variación de la media de división.
allkm = Table[
   Normal[allTimeSplits[[i]][2 ;;, "Time"]], {i,
Length[allTimeSplits]}];allsplitbins = DeleteMissing[Transpose[allkm], 2];meanall = Table[N[Mean[allsplitbins[[i]]]], {i, Length[allsplitbins]}]marathondistances = (allTimeSplits[[1]])[All, "Split"] // Normal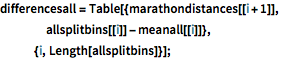
differencesall = Table[{marathondistances[[i + 1]],
    allsplitbins[[i]] - meanall[[i]]},
   {i, Length[allsplitbins]}];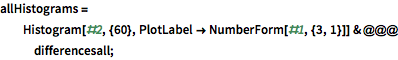
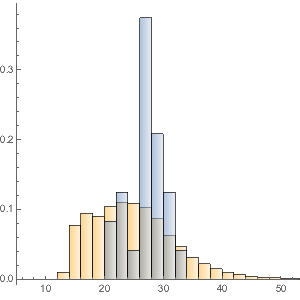
allHistograms =
  Histogram[#2, {60}, PlotLabel -> NumberForm[#1, {3, 1}]] & @@@
   differencesall;
Genere histogramas para cada división.
Grid[Partition[allHistograms, UpTo[3]]]
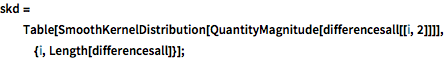
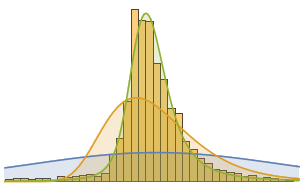
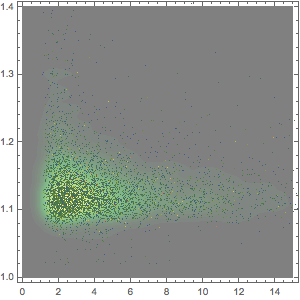
Grafique una distribución de núcleo alisada de las diferencias entre las divisiones de los corredores y las medias.