Use Databin to Store Time Series
The arrival times in a PoissonProcess are independent and follow an ExponentialDistribution. You can simulate a path of a PoissonProcess by sending signals to a Databin in time intervals specified by a simulation of an exponential distribution.
In[1]:=
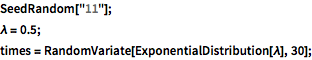
SeedRandom["11"];
\[Lambda] = 0.5;
times = RandomVariate[ExponentialDistribution[\[Lambda]], 30];
Create a Databin.
In[2]:=
bin = CreateDatabin[]Out[2]=
Use the simulated times to send 1 to the databin in time intervals.
In[3]:=
Table[DatabinAdd[bin, <|"arrivals" -> 1|>]; Pause[t], {t, times}];The recorded signal with the time stamps.
In[4]:=
TimeSeries[bin]Out[4]=
Extract the TimeSeries object.
In[5]:=
ts1 = TimeSeries[bin]["arrivals"]Out[5]=
This time series is irregularly sampled.
In[6]:=
RegularlySampledQ[ts1]Out[6]=
Assume TemporalRegularity so that Accumulate does not use interpolation to resample the time series with respect to the minimum time increment.
In[7]:=
ts2 = Accumulate[TimeSeries[ts1, TemporalRegularity -> True]]Out[7]=
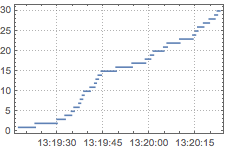
In[8]:=
DateListStepPlot[ts2, Joined -> False, PlotTheme -> "Detailed"]Out[8]=
Estimate the PoissonProcess parameter from the signal and compare to the parameter of the ExponentialDistribution used to simulate time stamps.
In[9]:=
{FindProcessParameters[ts2, PoissonProcess[\[Mu]]], \[Lambda]}Out[9]=