- Charts can now use the full power of Callout.
- Consider label sizes and available space when labeling points to avoid overlapping content.
- Improved automatic labeling of curves to avoid intersections and other ambiguous locations.
- Label the interior or boundary of regions in plots.
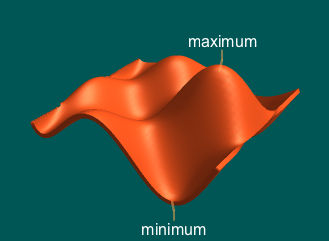
- Add labels and callouts to parametrized surfaces.
- Adjust the density of labels by controlling how big they can be.
- Give labels individual weights to affect which elements are labeled.
- Improved performance when labeling scenes with many elements.
Related Examples
Related Functions
- BarChart
- BubbleChart
- Callout
- DateListLogPlot
- DateListPlot
- DateListStepPlot
- DensityPlot
- DiscretePlot
- DiscretePlot3D
- FeatureSpacePlot
- FeatureSpacePlot3D
- GeoBubbleChart
- GeoListPlot
- GeoRegionValuePlot
- Labeled
- ListContourPlot
- ListDensityPlot
- ListLinePlot
- ListLogLinearPlot
- ListLogLogPlot
- ListLogPlot
- ListPlot
- ListPlot3D
- ListPointPlot3D
- ListPolarPlot
- ListStepPlot
- ParametricPlot
- ParametricPlot3D
- PieChart
- Plot3D
- PolarPlot
- RegionPlot
- RevolutionPlot3D
- SphericalPlot3D
- StackedDateListPlot
- StackedListPlot


