Automatic Labeling in BarChart
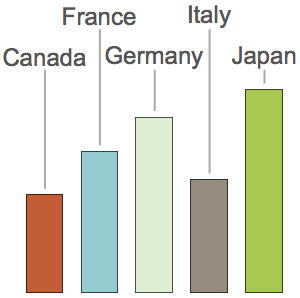
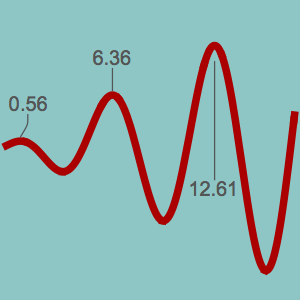
Use RectangleChart to show GDPs of the G7, where population is on the  axis and GDP per capita is on the
  axis. Label the bars using Callout with automatic positions.
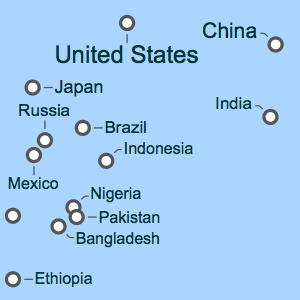
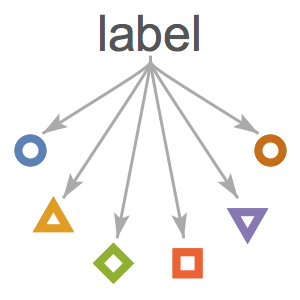
Label country names of grouped energy production data of G6 in BarChart and use a Callout wrapper to draw additional labels on individual bars. Group labels are arranged automatically.