Automatic Labeling in PieChart
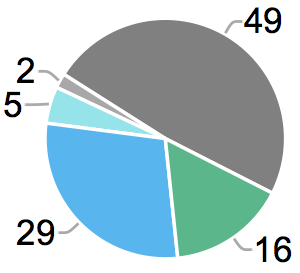
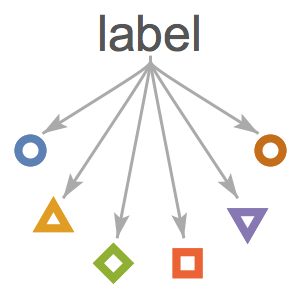
Callout in PieChart puts labels in the radial direction and adjusts the positions automatically.
Get the age data of all Titanic passengers.
Use HistogramList to categorize the age data in a step of 10 years.
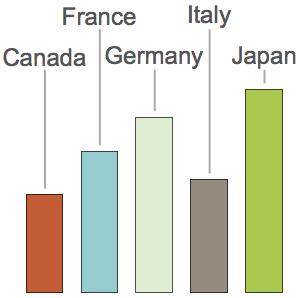
Visualize the composition of passengers of the Titanic in age group with PieChart.
Group the same data by sex.
Use HistogramList again to see how many male and female passengers there are in each age group.
Generate gender pie charts for each age group.
Use the gender pie charts as the labels used in the callouts.