Represent Time Series Data with TimeSeries and EventSeries
Mathematica 10 adds dedicated time series containers for continuously varying and discrete time series.
TimeSeries represents continuously varying time series.
| Out[1]= |  |
| Out[2]= | 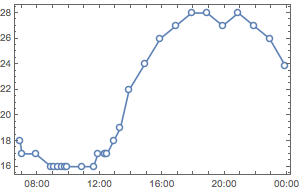 |
Find the temperature at a specific time, including in between recorded time stamps.
| Out[3]= |  |
EventSeries represents discrete time series.
| Out[4]= | 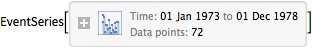 |
| Out[5]= |  |
Retrieve the number of accidental deaths in the US in January of 1975.
| Out[6]= |  |
Values in between recorded time stamps are unknown.
| Out[7]= |  |