| More about Mathematica » |
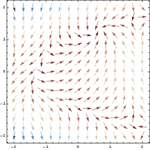
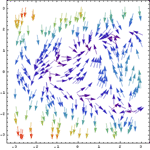
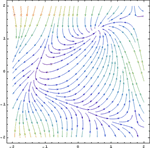
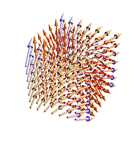
Mathematica 7 introduces state-of-the-art visualization of vector fields generated from both functions and data. Building on Mathematica's powerful capabilities in differential equations, geometry and symbolic analysis, Mathematica 7 brings a new level of automation and computational aesthetics to vector visualization. With applications in fluid mechanics, meteorology, electromagnetism, dynamical systems and other areas, Mathematica 7 for the first time allows textbook-quality images of vector fields to be generated immediately as a routine part of computational work.
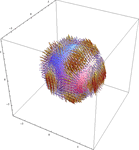
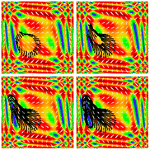
- Vector, quiver and glyph plots in 2D and 3D. »
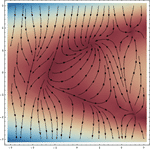
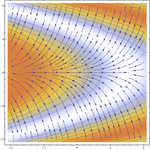
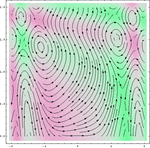
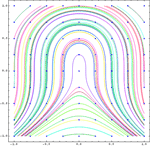
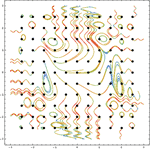
- Streamline plots with automatic streamline selection and placement. »
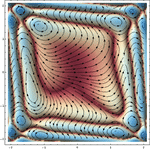
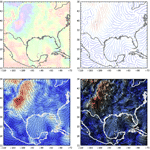
- Vector and streamline plots with density backgrounds. »
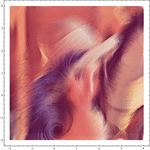
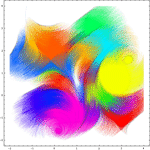
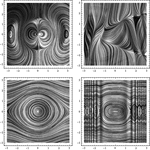
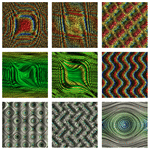
- Line integral convolution plots of vector fields. »
- Vector and streamline plots from regular and irregular data. »
- Automatic adaptive sampling for plotting vector functions.
- Automatic detection and handling of vector field singularities.
- Extensive options for rendering of vectors and streamlines.
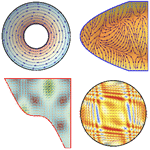
- Support for plotting regions of any shape. »
- Library of glyphs for vector and arrow styles. »
- Arbitrary "teardrops" and other deformable shapes for streamlines. »
- Full control over colors of vector and scalar elements.
- Support for simultaneous plotting of multiple functions and multiple datasets.
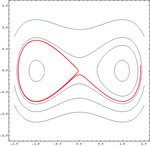
- Support for explicit as well as automatic seeding of streamlines. »


