

 Data Science
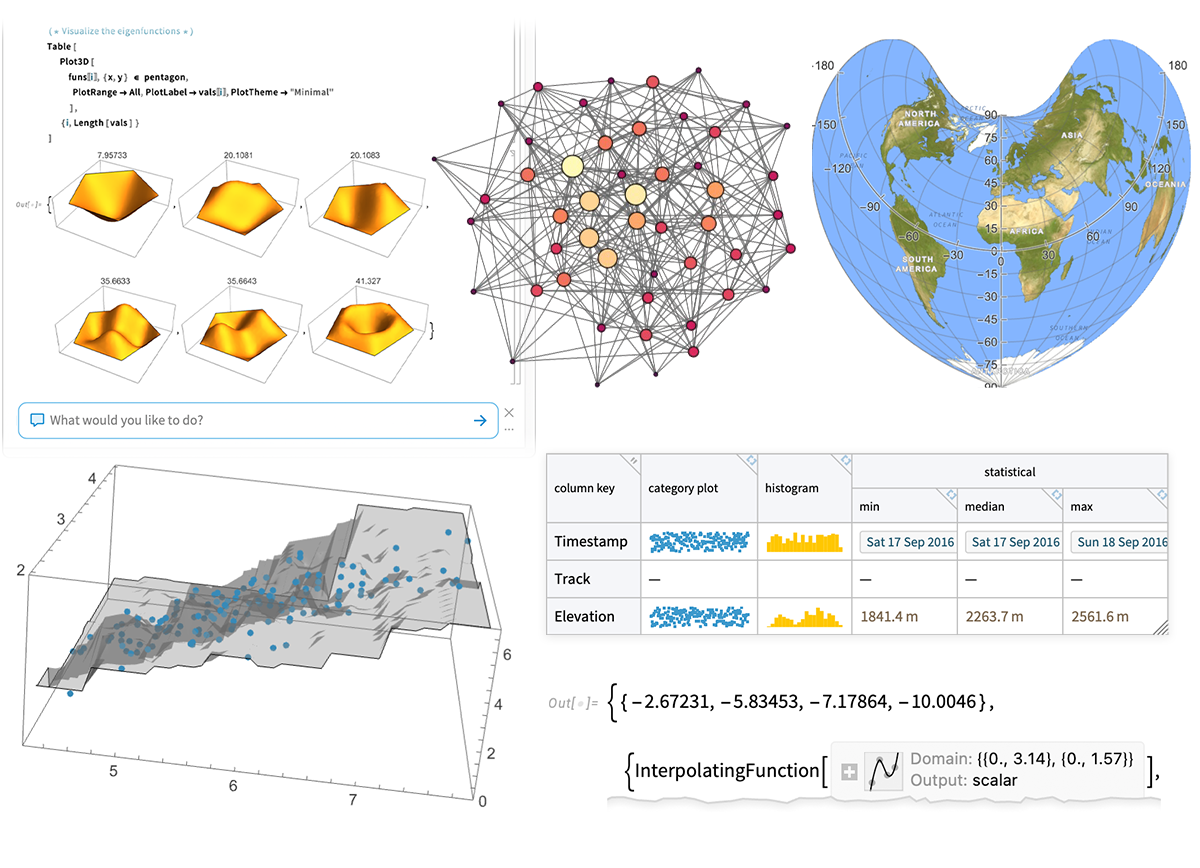
Employ a multiparadigm approach for your data science projects. Develop modular, flexible and scalable workflows to import, process, analyze and visualize data. Learn about easy-to-use functions, repositories, frameworks and interfaces while applying algorithms and techniques from across multiple disciplines.
These courses showcase some of the computational processes driving data analysis and visualization, the application of automated machine learning tools and the use of natural language queries within a symbolic framework. Topics covered also include the use of interactive Wolfram Notebooks and the cloud for generating reports and deploying data products. Earn course completion certificates and work toward Level 1 and Level 2 data science certifications.



Upcoming Events
-

OCT 2 & 9 | Online
Friday Study Group: Exploring Creative Data Analytics
This Study Group meets over two consecutive Fridays and explores case studies applying modern computation to business analytics. See examples that show how to work with text, image, video and web data in Wolfram Language. No prior programming experience is required, making this an ideal starting point for newcomers to computational analytics.
See Details and Register
OCT 8 | Online
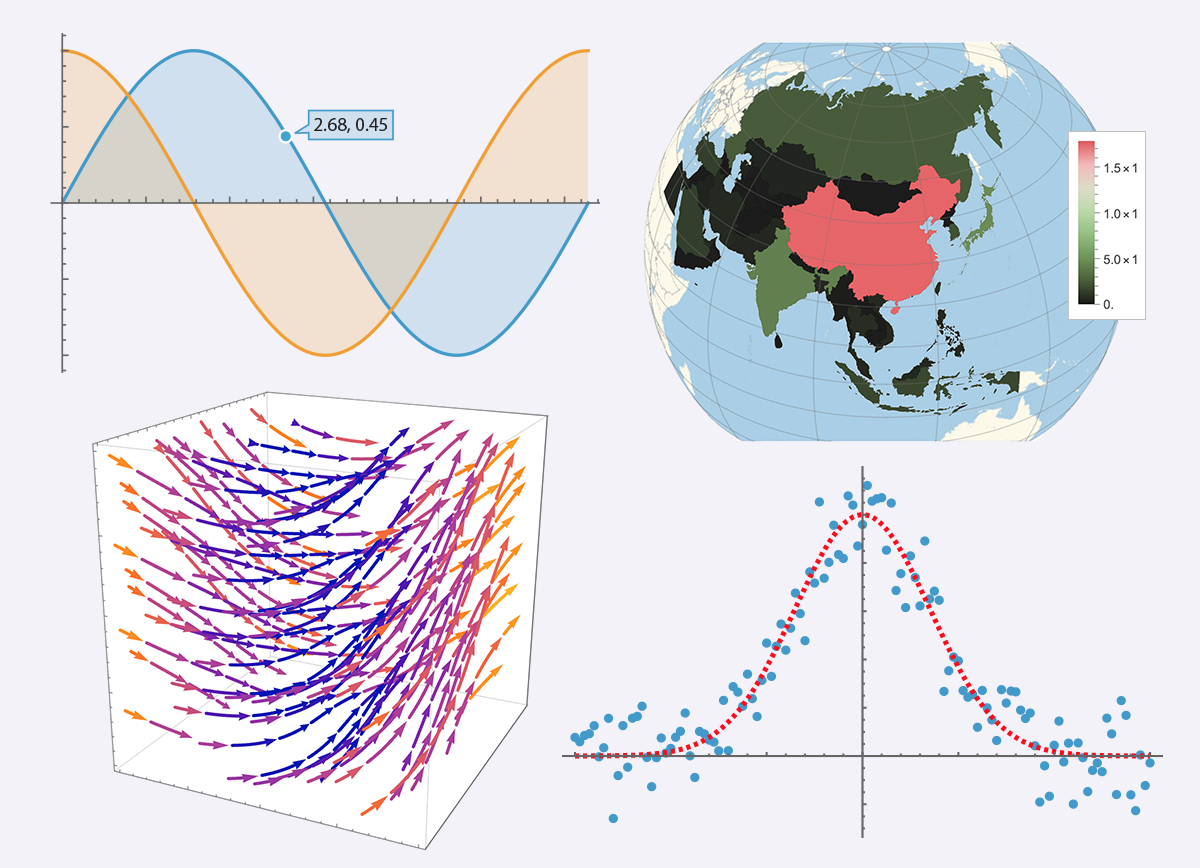
Function and Data Visualization: A Showcase of Plots, Charts and Graphics
Expand your skills for visualizing mathematical functions and improve your ability to represent different types of data with plots, charts and graphics of all kinds. You'll learn how functions and data can be plotted in one, two or three dimensions with Wolfram Language.
See Details and Register
Oct 15 | Online
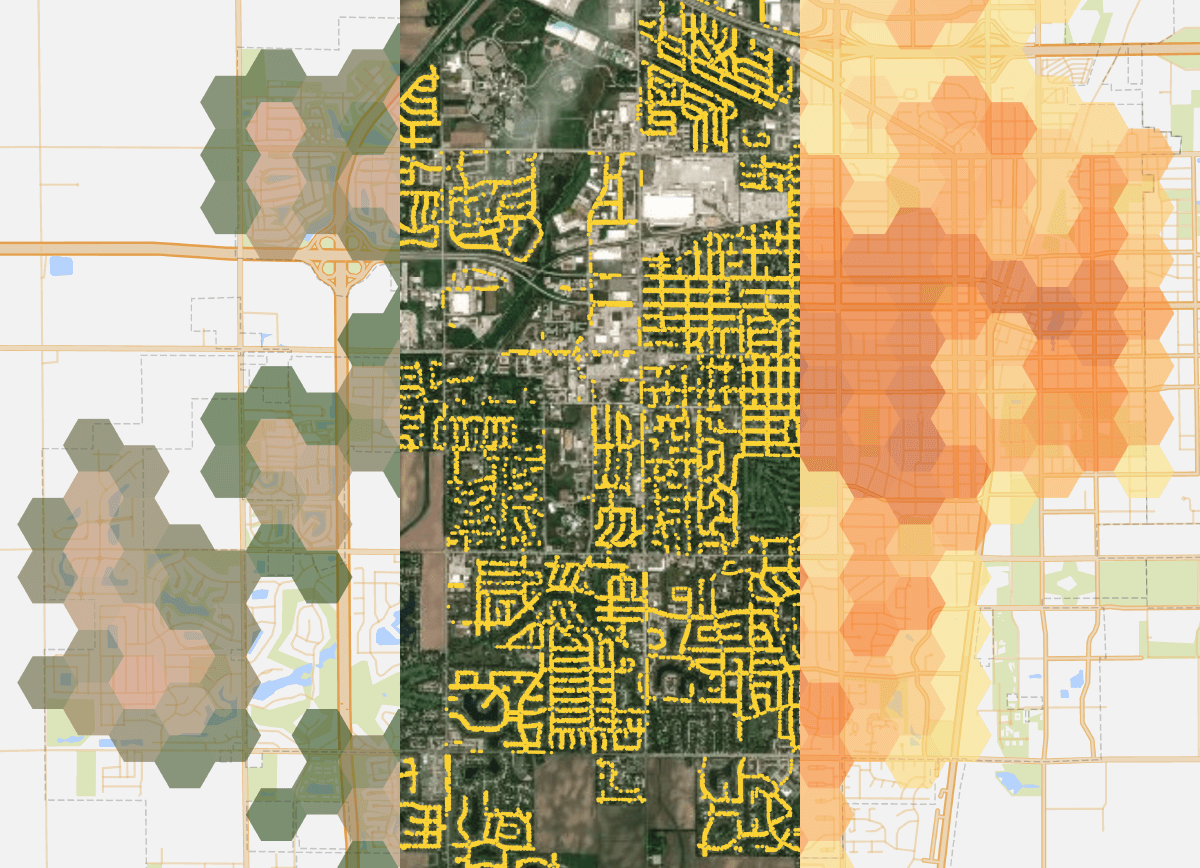
Computational Xplorations with Examples from Cartography and Data Analysis
This free introductory course demonstrates how to interactively explore nearly any field using computation. See additional course details, including more upcoming dates, on the course catalog page.