

 Visualization & Graphics
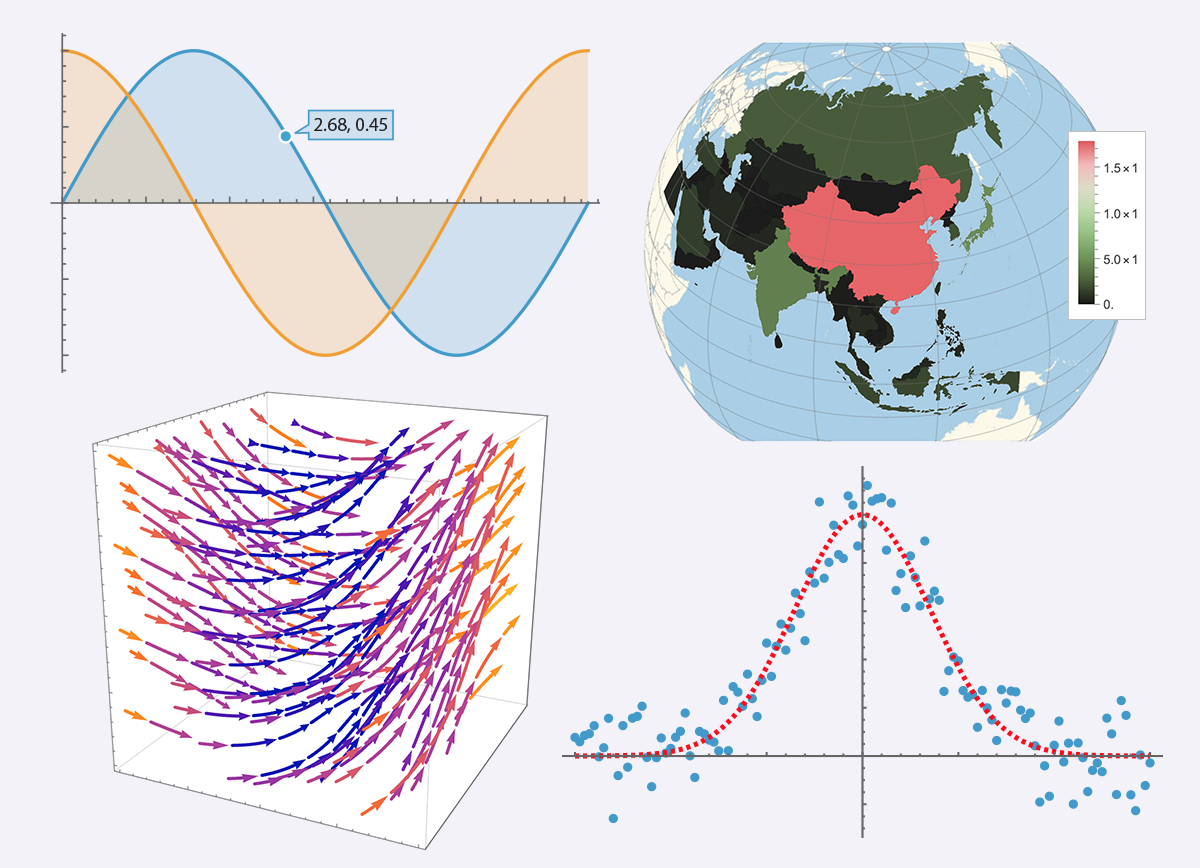
Visualization is a key step in analyzing and working with data. It is possible to create simple, easy-to-customize visualizations and even automate the process for a variety of data from multiple different sources. Learn how you can include great-looking visualizations in everything from personal data explorations to reports and academic papers.
These courses help you create cognitively and aesthetically compelling visuals and infographics. They also explain how to interactively share any type of data, including stylized plots, charts, 3D graphics and dynamic visualizations. Certification opportunities are available for proficiency in data science and visual explorations using Wolfram Language as well as for completion of specific courses.


Upcoming Events
-

Oct 2 & 9 | Online
Friday Study Group: Exploring Creative Data Analytics
This Study Group meets over two consecutive Fridays and explores case studies applying modern computation to business analytics. See examples that show how to work with text, image, video and web data in Wolfram Language. No prior programming experience is required, making this an ideal starting point for newcomers to computational analytics.
-
OCT 7–28 | Online
Using Computation in Your Research and Teaching
This collection of webinars has been developed especially for researchers, professionals and students to show how modern computation can be injected into nearly any field. Sign up for one or more sessions and see how Wolfram Language integrates built-in algorithms, powerful data visualization tools and real-world knowledge to advance research and teaching.
-
OCT 8 | Online
Function and Data Visualization: A Showcase of Plots, Charts and Graphics
Expand your skills for visualizing mathematical functions and improve your ability to represent different types of data with plots, charts and graphics of all kinds. You'll learn how functions and data can be plotted in one, two or three dimensions with Wolfram Language.