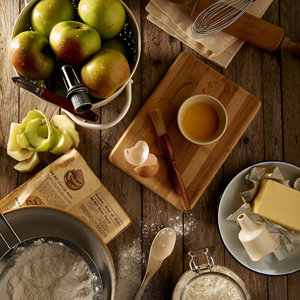
Analysez, visualisez et comparez les « super-aliments »
Les super-aliments sont des aliments très riches en un ou plusieurs nutriments. Cet exemple définit un ensemble de super-aliments, puis les compare à des aliments plus « typiques » en utilisant les données alimentaires de la base de connaissances de Wolfram. Pour finir, il construit un insigne approprié pour les aliments dignes de l'épithète « super ».
Pour commencer, définissez une liste de super-aliments contenant les nutriments pour lesquels ils sont connus.
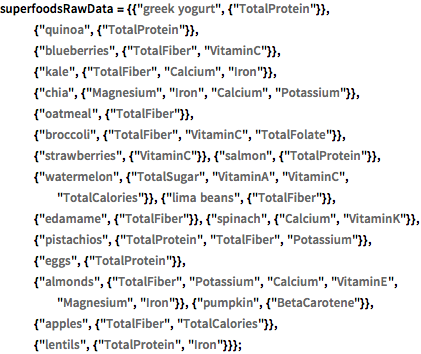
superfoodsRawData = {{"greek yogurt", {"TotalProtein"}}, {"quinoa", \
{"TotalProtein"}}, {"blueberries", {"TotalFiber",
     "VitaminC"}}, {"kale", {"TotalFiber", "Calcium",
     "Iron"}}, {"chia", {"Magnesium", "Iron", "Calcium",
     "Potassium"}}, {"oatmeal", {"TotalFiber"}}, {"broccoli", \
{"TotalFiber", "VitaminC",
     "TotalFolate"}}, {"strawberries", {"VitaminC"}}, {"salmon", \
{"TotalProtein"}}, {"watermelon", {"TotalSugar", "VitaminA",
     "VitaminC", "TotalCalories"}}, {"lima beans", {"TotalFiber"}},
   {"edamame", {"TotalFiber"}}, {"spinach", {"Calcium",
     "VitaminK"}}, {"pistachios", {"TotalProtein", "TotalFiber",
     "Potassium"}}, {"eggs", {"TotalProtein"}}, {"almonds", \
{"TotalFiber", "Potassium", "Calcium", "VitaminE", "Magnesium",
     "Iron"}}, {"pumpkin", {"BetaCarotene"}}, {"apples", \
{"TotalFiber", "TotalCalories"}}, {"lentils", {"TotalProtein",
     "Iron"}}};
Convertissez-le en Dataset pour faciliter les calculs.
superfoodsDatset =
 Dataset[<|"Food" -> #1, "Nutrients" -> #2|> & @@@ superfoodsRawData]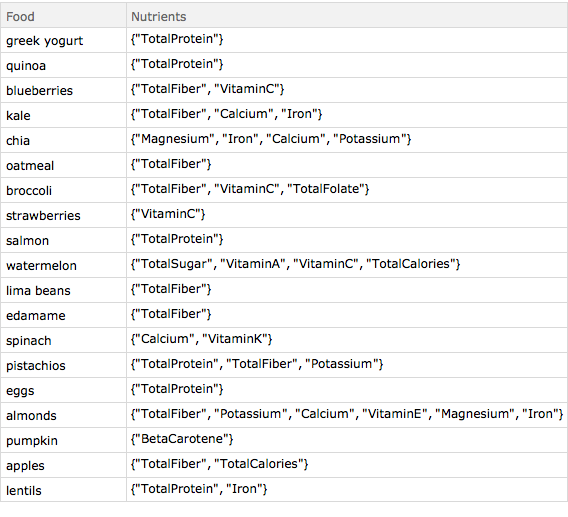
Utilisez Interpreter pour obtenir des entités Wolfram Language pour les super-aliments.
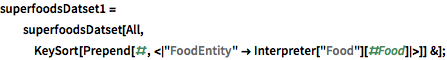
superfoodsDatset1 =
  superfoodsDatset[All,
   KeySort[Prepend[#, <|
       "FoodEntity" -> Interpreter["Food"][#Food]|>]] &];
Dressez la liste des nutriments.
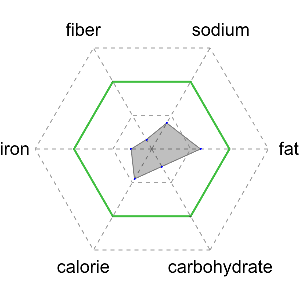
Union @@ Normal[superfoodsDatset1[[All, "Nutrients"]]]Créez des règles pour convertir les nutriments donnés en propriétés appropriées.
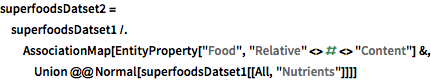
superfoodsDatset2 =
 superfoodsDatset1 /.
  AssociationMap[
   EntityProperty["Food", "Relative" <> # <> "Content"] &,
Union @@ Normal[superfoodsDatset1[[All, "Nutrients"]]]]Trouvez les nutriments les plus courants dans le Dataset.
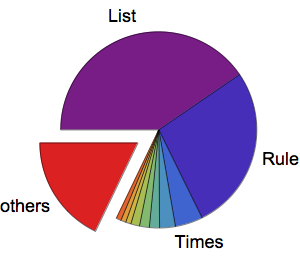
mostCommonProperties =
 superfoodsDatset2[Counts[Flatten[#]] &, "Nutrients"][TakeLargest[5]]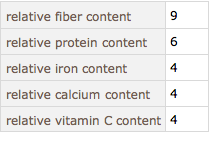
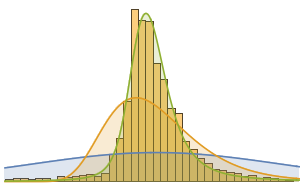
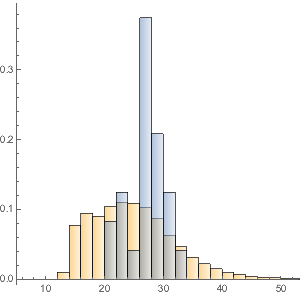
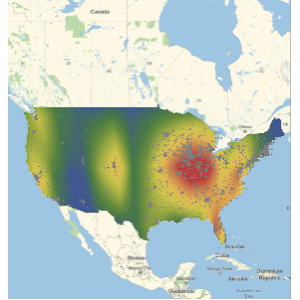
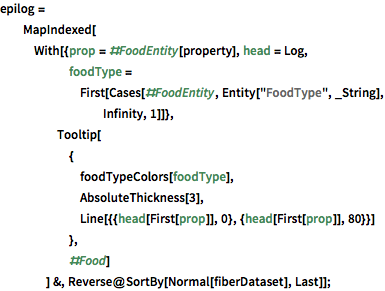
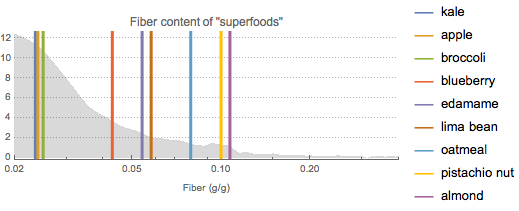
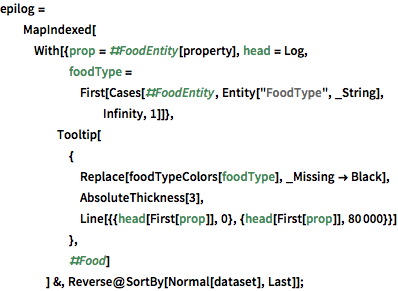
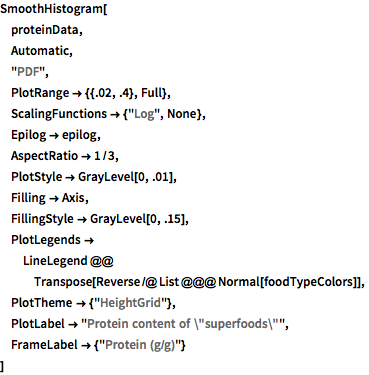
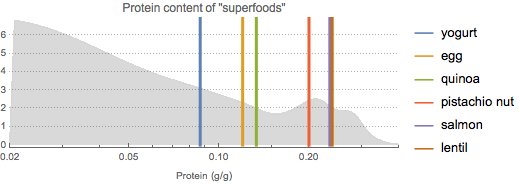
Trouvez les super-aliments connus pour leur teneur élevée en fibres et comparez-les à près de 9 000 autres aliments. Visualisez-les sous la forme d'un histogramme lissé, où la courbe grise représente la fonction de densité de probabilité de la teneur en fibres de la plupart des aliments.
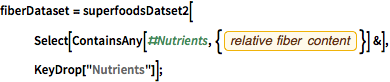
fiberDataset =
  superfoodsDatset2[
   Select[ContainsAny[#Nutrients, {EntityProperty["Food",
        "RelativeTotalFiberContent"]}] &], KeyDrop["Nutrients"]];
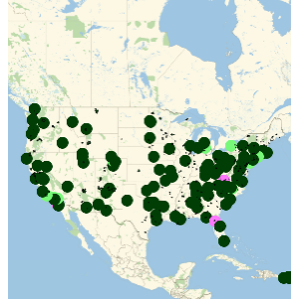
Procédez de la même manière pour les super-aliments riches en protéines.
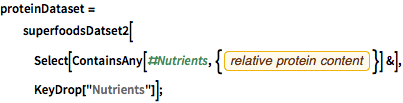
proteinDataset =
  superfoodsDatset2[
   Select[ContainsAny[#Nutrients, {EntityProperty["Food",
        "RelativeTotalProteinContent"]}] &], KeyDrop["Nutrients"]];
Créez un insigne des super-aliments en commençant par une série d'images de super-aliments.
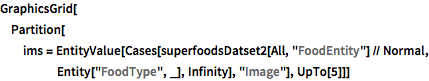
GraphicsGrid[
 Partition[
  ims = EntityValue[
    Cases[superfoodsDatset2[All, "FoodEntity"] // Normal,
     Entity["FoodType", _], Infinity], "Image"], UpTo[5]]]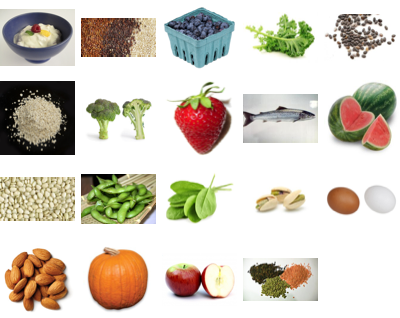
Pour l'arrière-plan, utilisez une forme ressemblant à celle d'un super-aliment bien connu.
Entity["Lamina", "SupermanInsigniaLamina"]["Image"] // ImageCrop
Utilisez un traitement d'image simple pour la convertir en arrière-plan.
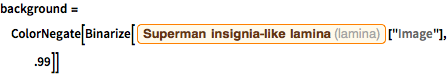
background =
 ColorNegate[
  Binarize[Entity["Lamina", "SupermanInsigniaLamina"]["Image"], .99]]
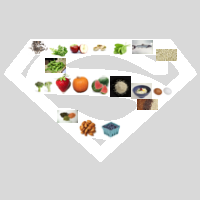
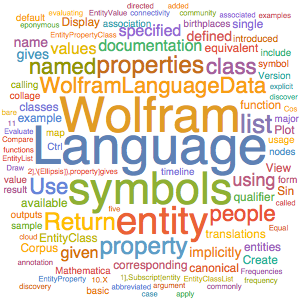
Créez un « nuage de mots » composé de super-aliments.
wc = WordCloud[(RandomReal[{0.6, 1.2}] -> #) & /@ ims, background]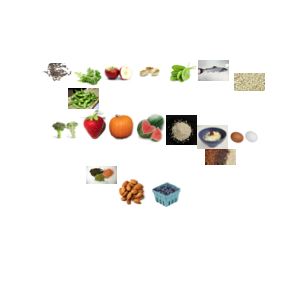
Combinez le nuage de mots et l'arrière-plan.
ImageMultiply[{ColorReplace[background, Black -> LightGray], wc}]