Visualize Nutrition in Terms of Daily Recommended Values
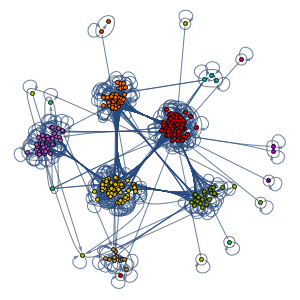
The Wolfram Knowledgebase includes not only detailed properties and nutritional information for more than 37,000 "Food" and 1000 "FoodType" entities, but also data on Daily Recommended Values for 176 nutrients. Together, these extensive datasets allow virtually any meal's nutritional content to be explored computationally, then intuitively visualized using a simple plot.
EntityValue["Nutrient", "EntityCount"]Retrieve a list of nutrient Daily Recommended Values based on a 2000 Calorie/day diet.
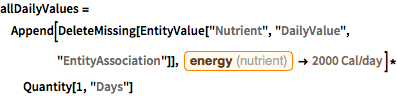
allDailyValues =
 Append[DeleteMissing[
    EntityValue["Nutrient", "DailyValue", "EntityAssociation"]],
   Entity["Nutrient", "Energy"] ->
    Quantity[2000, ("LargeCalories")/("Days")]]*Quantity[1, "Days"]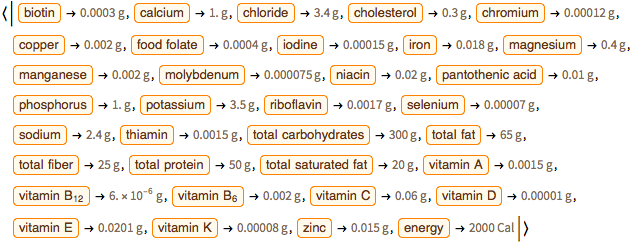
Map food properties to nutrients.
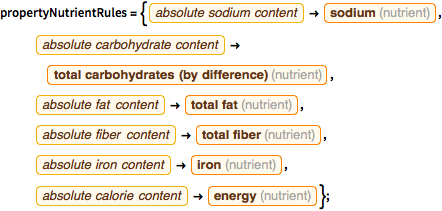
propertyNutrientRules = {EntityProperty["Food",
     "AbsoluteSodiumContent"] -> Entity["Nutrient", "Sodium"],
   EntityProperty["Food", "AbsoluteTotalCarbohydratesContent"] ->
    Entity["Nutrient", "TotalCarbohydrates"],
   EntityProperty["Food", "AbsoluteTotalFatContent"] ->
    Entity["Nutrient", "TotalFat"],
   EntityProperty["Food", "AbsoluteTotalFiberContent"] ->
    Entity["Nutrient", "TotalFiber"],
   EntityProperty["Food", "AbsoluteIronContent"] ->
    Entity["Nutrient", "Iron"],
   EntityProperty["Food", "AbsoluteTotalCaloriesContent"] ->
    Entity["Nutrient", "Energy"]};
Encode a typical breakfast using EntityGroup and EntityInstance.
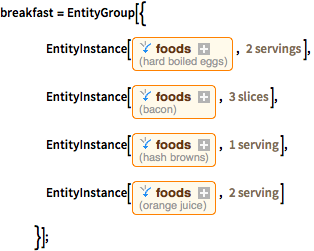
breakfast = EntityGroup[{
EntityInstance[Entity[
"Food", {
EntityProperty["Food", "CookingMethod"] -> Entity[
"CookingMethod", "HardBoiled"],
EntityProperty["Food", "FoodType"] -> ContainsExactly[{
Entity["FoodType", "Egg"]}],
EntityProperty[
"Food", "AddedFoodTypes"] -> ContainsExactly[{}]}],
Quantity[2, "Servings"]],
EntityInstance[Entity[
"Food", {EntityProperty["Food", "FoodType"] -> ContainsExactly[{
Entity["FoodType", "Bacon"]}],
EntityProperty[
"Food", "AddedFoodTypes"] -> ContainsExactly[{}]}],
Quantity[3, "Slices"]],
EntityInstance[Entity[
"Food", {EntityProperty["Food", "FoodType"] -> ContainsExactly[{
Entity["FoodType", "HashBrown"]}],
EntityProperty[
"Food", "AddedFoodTypes"] -> ContainsExactly[{}]}],
Quantity[1, "Servings"]],
EntityInstance[Entity[
"Food", {EntityProperty["Food", "FoodType"] -> ContainsExactly[{
Entity["FoodType", "OrangeJuice"]}],
EntityProperty[
"Food", "AddedFoodTypes"] -> ContainsExactly[{}]}],
Quantity[2, "Servings"]]
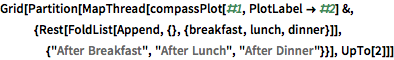
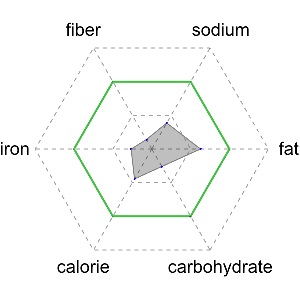
}];Construct a "compass plot" showing radially nested hexagons indicating 50%, 100% (marked in green), and 150% of Daily Recommended Values for six primary nutrients.
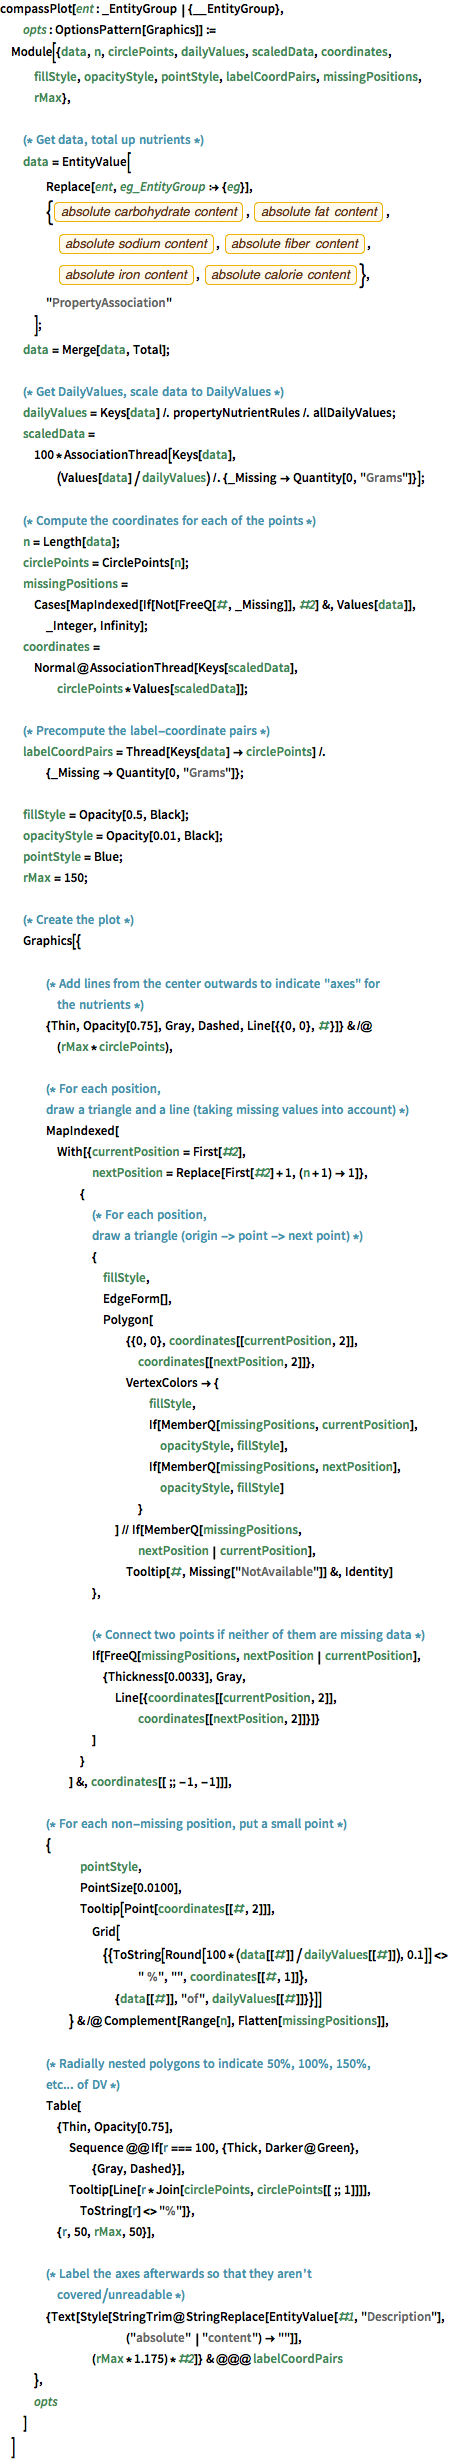
compassPlot[breakfast]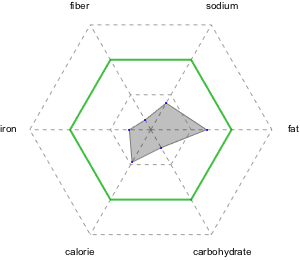
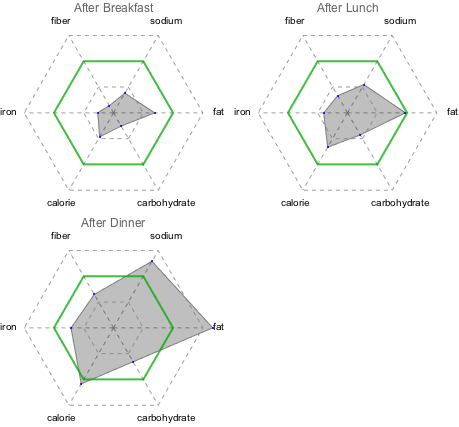
Specify lunch and dinner in addition to breakfast.
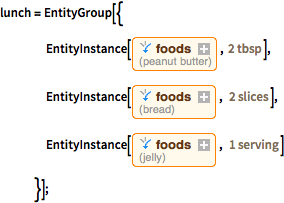
lunch = EntityGroup[{
    EntityInstance[Entity[
     "Food", {EntityProperty["Food", "FoodType"] -> ContainsExactly[{
Entity["FoodType", "PeanutButter"]}],
       EntityProperty[
        "Food", "AddedFoodTypes"] -> ContainsExactly[{}]}],
     Quantity[2, "Tablespoons"]],
    EntityInstance[Entity[
     "Food", {EntityProperty["Food", "FoodType"] -> ContainsExactly[{
Entity["FoodType", "Bread"]}],
       EntityProperty[
        "Food", "AddedFoodTypes"] -> ContainsExactly[{}]}],
     Quantity[2, "Slices"]],
    EntityInstance[Entity[
     "Food", {EntityProperty["Food", "FoodType"] -> ContainsExactly[{
Entity["FoodType", "Jelly"]}],
       EntityProperty[
        "Food", "AddedFoodTypes"] -> ContainsExactly[{}]}],
     Quantity[1, "Servings"]]
    }];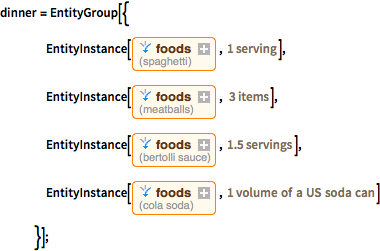
dinner = EntityGroup[{
    EntityInstance[Entity[
     "Food", {EntityProperty["Food", "FoodType"] -> ContainsExactly[{
Entity["FoodType", "Spaghetti"]}],
       EntityProperty[
        "Food", "AddedFoodTypes"] -> ContainsExactly[{}]}],
     Quantity[1, "Servings"]],
    EntityInstance[Entity[
     "Food", {EntityProperty["Food", "FoodType"] -> ContainsExactly[{
Entity["FoodType", "Meatball"]}],
       EntityProperty[
        "Food", "AddedFoodTypes"] -> ContainsExactly[{}]}],
     Quantity[3, "Items"]],
    EntityInstance[Entity[
     "Food", {
      EntityProperty["Food", "BrandName"] -> Entity[
        "FoodBrandName", "Bertolli"],
       EntityProperty["Food", "FoodType"] -> ContainsExactly[{
Entity["FoodType", "Sauce"]}],
       EntityProperty[
        "Food", "AddedFoodTypes"] -> ContainsExactly[{}]}],
     Quantity[1.5, "Servings"]],
    EntityInstance[Entity[
     "Food", {
      EntityProperty["Food", "Flavor"] -> Entity[
        "FoodFlavor", "Cola"],
       EntityProperty["Food", "FoodType"] -> ContainsExactly[{
Entity["FoodType", "CarbonatedBeverage"]}],
       EntityProperty[
        "Food", "AddedFoodTypes"] -> ContainsExactly[{}]}],
     Quantity[1, "USSodaCanVolumes"]]
    }];
Visualize incremental nutrition coverage after each meal.