| 14 | Coordinates and Graphics |
We
’ve used
ListPlot and
ListLinePlot to plot lists of values, where each value appears after the one before. But by giving lists containing
pairs of coordinates instead of single values, we can use these functions to plot points at arbitrary positions.
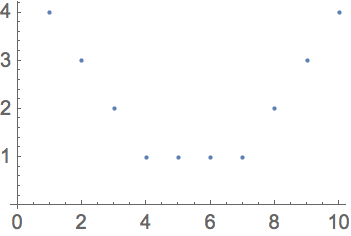
Plot a list of values where each value appears after the one before:
Plot a sequence of arbitrary points specified by {
x,
y} coordinates:
The position of each point here is specified by {
x,
y} coordinates. Following the standard convention in mathematics, the
x value says how far across horizontally the point should be; the
y value says how far up vertically it should be.
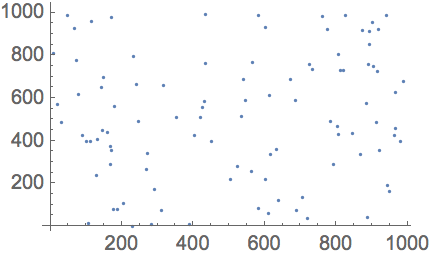
Generate a sequence of random {x, y} coordinates:
Another way to get random coordinates:
Plot 100 points at random coordinates:
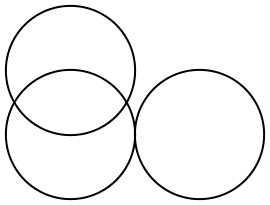
We can use coordinates to construct graphics.
Earlier we saw how to make graphics of one circle. To make graphics of more than one circle we have to say where each circle is, which we can do by giving the coordinates of their centers.
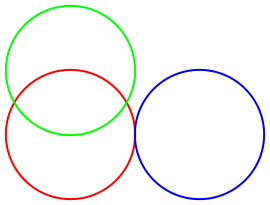
Place circles by giving the coordinates of their centers:
If we apply color styles it’s easier to see which circle is which:
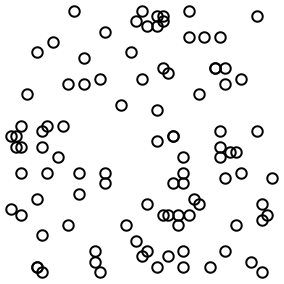
Make a graphic with 100 randomly placed circles, each with center coordinates up to 50:
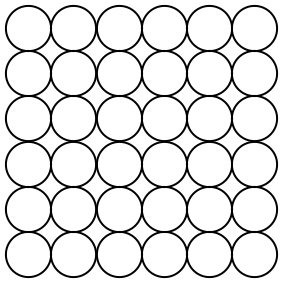
A 2D array of circles, arranged so that they just touch:
Circle[{x,y}] means a circle centered at position
{x,y}. If you don
’t say otherwise, the circle is given radius 1. You can make a circle of any radius using
Circle[{x,y},r].
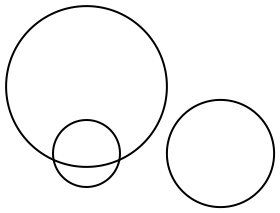
Use different radii for different circles:
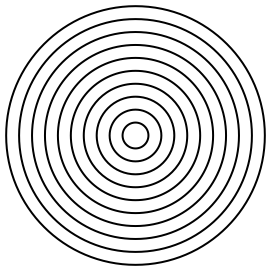
Make 10 concentric circles:
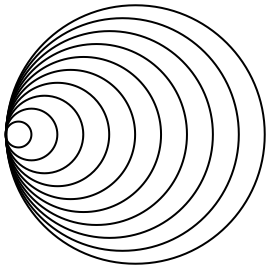
Draw larger circles with centers that shift progressively to the right:
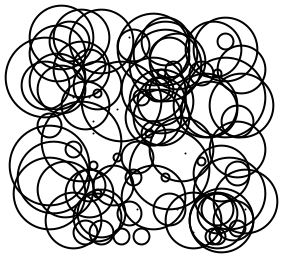
Pick both positions and radii at random:
RegularPolygon works much the same as
Circle and
Disk, except that in addition to giving the position of the center and the size, you also have to specify how many sides the polygon should have.
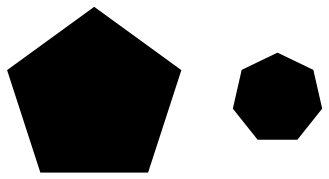
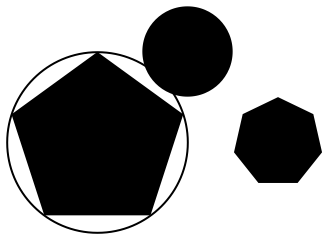
Make graphics of a size-1 regular pentagon and a size-0.5 regular heptagon:
You can mix different kinds of graphics objects:
To make arbitrary graphics, you need the basic
graphics primitives Point,
Line and
Polygon.
Point[{x,y}] represents a point at coordinate position
{x,y}. To get multiple points, you can either give a list of
Point[{x,y}]s, or you can give a list of coordinate positions inside a single
Point.
Graphics of three points at specified positions:
An alternative form, where all the coordinate positions are collected in a single list:
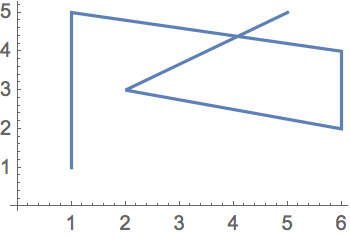
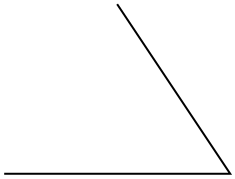
Make a line joining the positions:
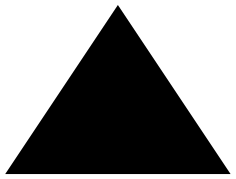
Make a polygon with corners at the positions you give:
RegularPolygon makes a regular polygon in which all sides and angles are the same.
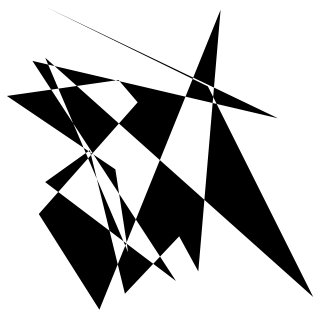
Polygon lets you make any polygon, even strange ones that fold over themselves.
A polygon with 20 corners at random coordinates below 100; the polygon folds over itself:
The things we
’ve done so far here immediately generalize to 3D. Instead of having two coordinates {
x,
y} we have three: {
x,
y, z}. In the Wolfram Language,
x by default goes across the screen,
y goes
“into
” the screen, and
z goes up the screen.
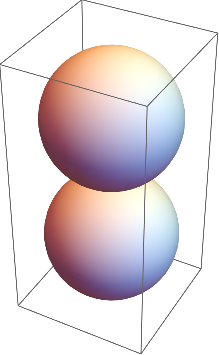
Two spheres stacked on top of each other:
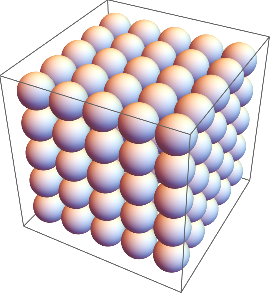
A 3D array of spheres (radius 1/2 makes them just touch):
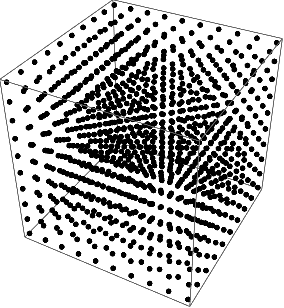
A 3D array of points:
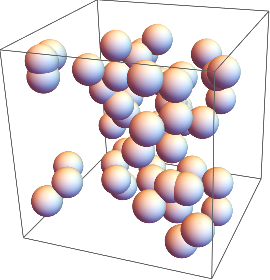
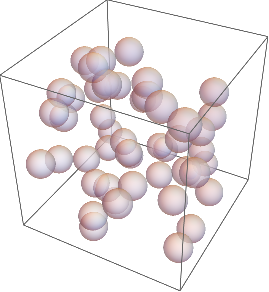
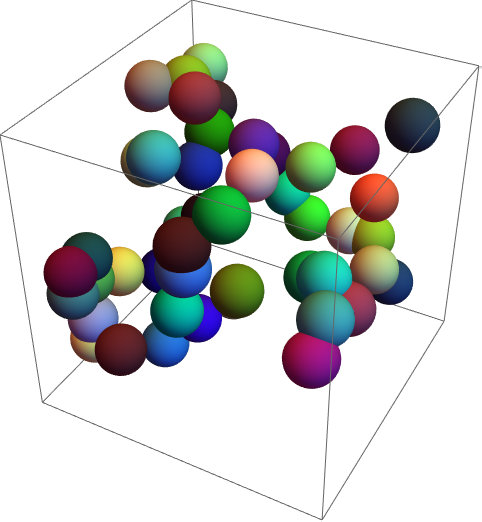
50 spheres at random 3D positions, with each coordinate running up to 10:
If you don
’t say otherwise, 3D objects like spheres are drawn solid, so you can
’t see through them. But just like you can specify what color something is, you can also specify its
opacity. Opacity 1 means completely opaque, so you can
’t see through it at all; opacity 0 means completely transparent.
Specify opacity 0.5 for all spheres:
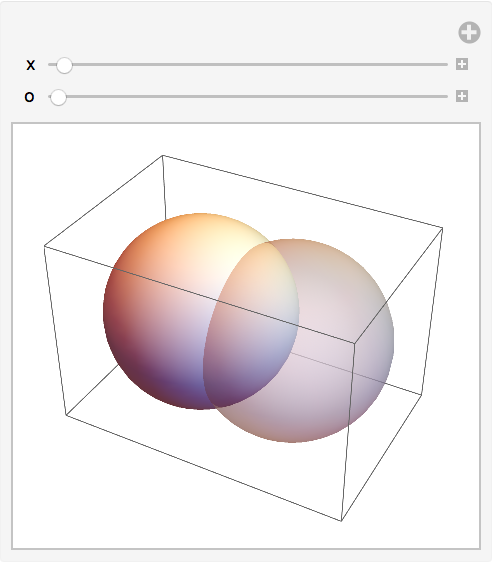
You can use
Manipulate to make graphics
—in 2D or 3D
—that can be manipulated.
Manipulate the position and opacity of the second sphere:
| Point[{x,y}] | | a point at coordinates {x, y} |
| Line[{{1,1},{2,4},{1,2}}] | | a line connecting specified coordinates |
| Circle[{x,y}] | | a circle with center at {x, y} |
| Circle[{x,y},r] | | a circle with center at {x, y} and radius r |
| RegularPolygon[{x,y},s,n] | | a regular polygon with center {x, y}
and n sides each s long |
| Polygon[{{1,1},{2,4},{1,2}}] | | a polygon with the specified corners |
| Sphere[{x,y,z}] | | a sphere with center at {x, y, z} |
| Sphere[{x,y,z},r] | | a sphere with center at {x, y, z} and radius r |
| Opacity[level] | | specify an opacity level (0: transparent; 1: solid) |
14.1Make graphics of 5 concentric circles centered at
{0, 0} with radii 1, 2,
... , 5.
»
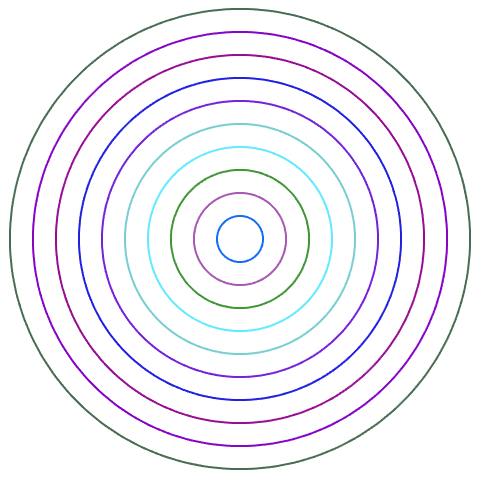
14.2Make 10 concentric circles with random colors.
»
14.3Make graphics of a 10
×10 grid of circles with radius 1 centered at integer points
{x, y}.
»
14.4Make a 10
×10 grid of points with coordinates at integer positions up to 10.
»
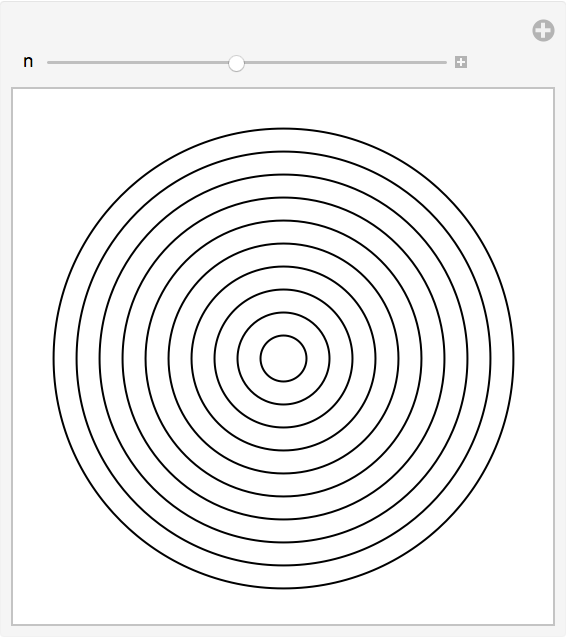
14.5Make a
Manipulate with between 1 and 20 concentric circles.
»
14.6Place 50 spheres with random colors at random integer coordinates up to 10.
»
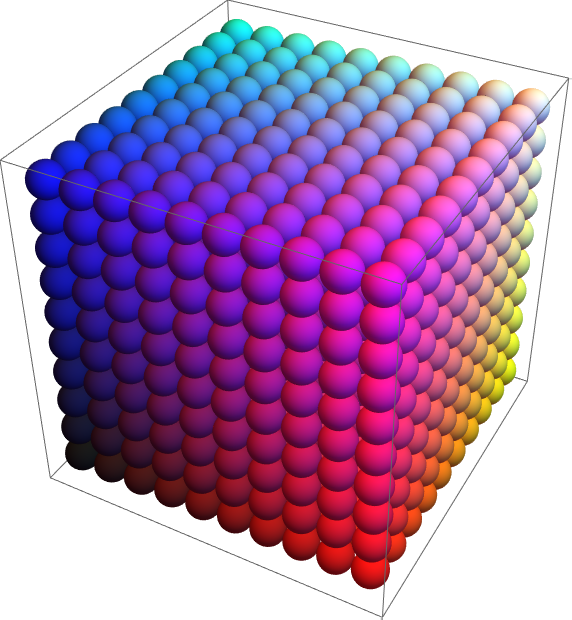
14.7Make a 10
×10
×10 array of spheres with RGB components ranging from 0 to 1. The spheres should be centered at integer coordinates, and should just touch each other.
»
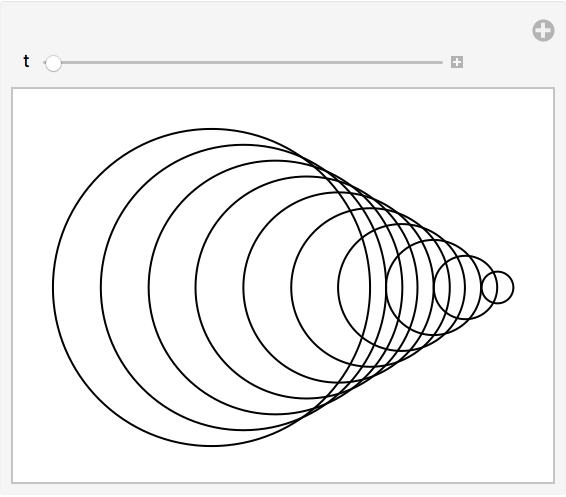
14.8Make a
Manipulate with
t varying between
−2 and +2 that contains circles of radius
x centered at
{t*x, 0} with
x going from 1 to 10.
»
14.9Make a 5
×5 array of regular hexagons with size 1/2, centered at integer points.
»
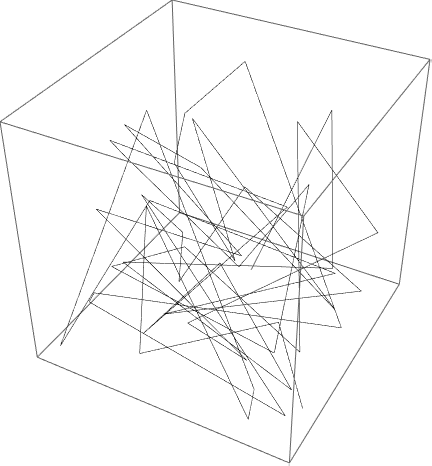
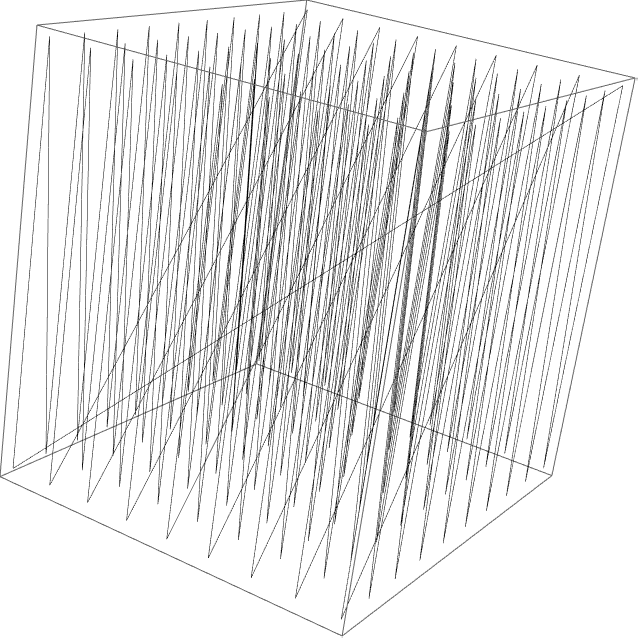
14.10Make a line in 3D that goes through 50 random points with integer coordinates randomly chosen up to 50.
»
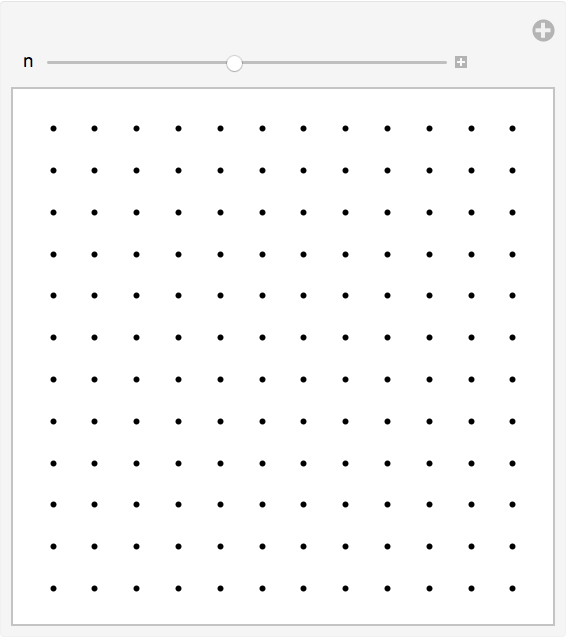
+14.1Make a
Manipulate to create an
n×n regular grid of points at integer positions, with
n going from 5 to 20.
»
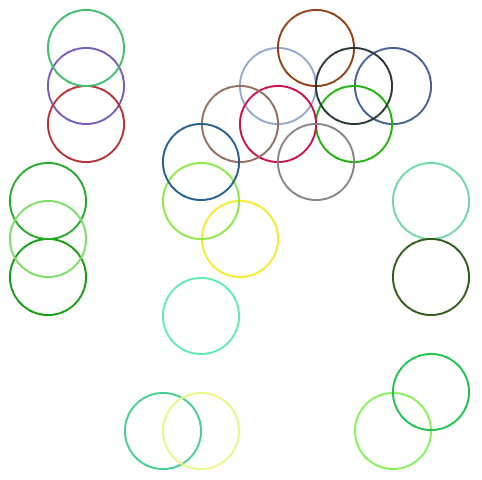
+14.2Place 30 radius-1 circles with random colors at random integer coordinates up to 10.
»
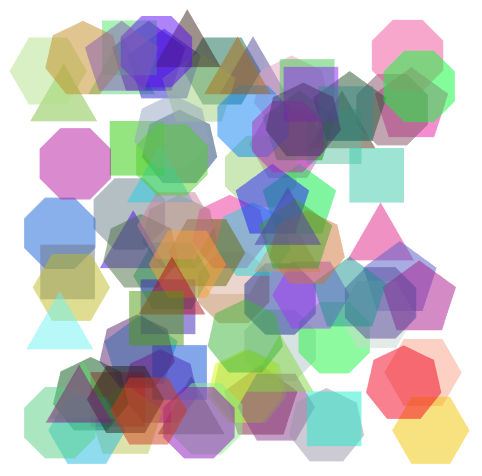
+14.3Display 100 polygons with side length 10, opacity .5, and random choices of colors, sides between 3 and 8, and integer coordinates up to 100.
»
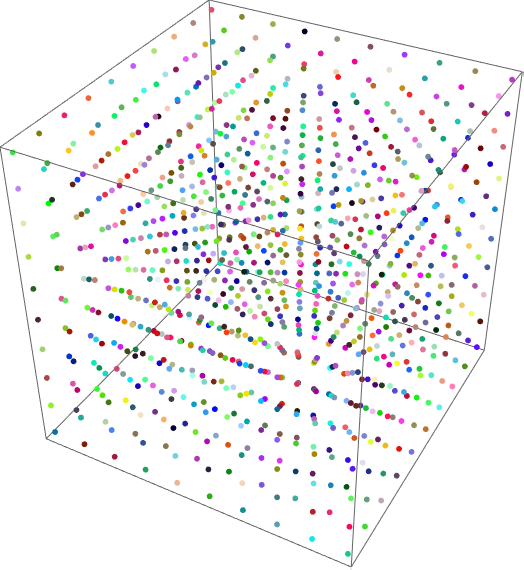
+14.4Make a 10
×10
×10 array of points in 3D, with each point having a random color.
»
+14.5Take the first two digits of numbers from 10 to 100 and draw a line that uses them as coordinates.
»
+14.6Take the first 3 digits of numbers from 100 to 1000 and draw a line in 3D that uses them as coordinates.
»
What determines the range of coordinates shown?
By default it
’s picked automatically, but you can set it explicitly using the
PlotRange option, as discussed in
Section 20.
How can I put axes on graphics?
How do I change the appearance of the edges of a polygon or disk?
What other graphics constructs are there?
How do I get rid of the box around 3D graphics?
- The random circles here are drawn at integer coordinates. You can use RandomReal to place them at arbitrary coordinates.
- Instead of using Style, you can give directives for graphics in a list, like {Red, Disk[]}. A particular directive will affect every graphics object that appears after it in the list.
- In 2D graphics, objects are drawn in whatever order you give them, so later ones can cover up earlier ones.
- You can apply geometric transformations to graphics objects using functions like Translate, Scale and Rotate.
- Polygons that fold over themselves (say, to make a bowtie shape) are displayed using an even-odd rule.
- 3D graphics can include Cuboid, Tetrahedron and polyhedra specified by PolyhedronData, as well as shapes defined by arbitrary meshes of points in 3D space.