スミス(Smith)分解を使って,格子を解析する
ベクトル と
の倍数である整数によって生成された格子
を考える.
In[1]:=
![Click for copyable input](assets.ja/use-the-smith-decomposition-to-analyze-a-lattice/In_92.png)
b1 = {3, -3};
b2 = {2, 1};
In[2]:=
![Click for copyable input](assets.ja/use-the-smith-decomposition-to-analyze-a-lattice/In_93.png)
ptsb = Flatten[Table[j b1 + k b2, {j, -12, 12}, {k, -12, 12}], 1];
In[3]:=
![Click for copyable input](assets.ja/use-the-smith-decomposition-to-analyze-a-lattice/In_94.png)
graphicsb =
Graphics[{Blue, PointSize[Large], Point@ptsb}, PlotRange -> 10,
Axes -> True]
Out[3]=
![](assets.ja/use-the-smith-decomposition-to-analyze-a-lattice/O_80.png)
を,行が
と
の行列とする.
In[4]:=
![Click for copyable input](assets.ja/use-the-smith-decomposition-to-analyze-a-lattice/In_95.png)
m = {b1, b2};
スミス分解は恒等式 を満足する3つの行列を与える.
In[5]:=
![Click for copyable input](assets.ja/use-the-smith-decomposition-to-analyze-a-lattice/In_96.png)
{u, r, v} = SmithDecomposition[m];
In[6]:=
![Click for copyable input](assets.ja/use-the-smith-decomposition-to-analyze-a-lattice/In_97.png)
u.m.v == r
Out[6]=
![](assets.ja/use-the-smith-decomposition-to-analyze-a-lattice/O_81.png)
行列 と
は整数の要素と行列式1を持つ.
In[7]:=
![Click for copyable input](assets.ja/use-the-smith-decomposition-to-analyze-a-lattice/In_98.png)
{u // MatrixForm, v // MatrixForm, Det[u], Det[v]}
Out[7]=
![](assets.ja/use-the-smith-decomposition-to-analyze-a-lattice/O_82.png)
行列 は整数であり対角行列である.その項目から,
は自明群なので,群
の構造は
(単純に
)であることが分かる.
In[8]:=
![Click for copyable input](assets.ja/use-the-smith-decomposition-to-analyze-a-lattice/In_99.png)
r // MatrixForm
Out[8]//MatrixForm=
![](assets.ja/use-the-smith-decomposition-to-analyze-a-lattice/O_83.png)
恒等式 に
を掛けると
になる.
は整数であり,行列式は
なので,
は
と等しいが格段に単純な格子を生成する.
In[9]:=
![Click for copyable input](assets.ja/use-the-smith-decomposition-to-analyze-a-lattice/In_100.png)
g = r.Inverse[v];
g // MatrixForm
Out[9]//MatrixForm=
![](assets.ja/use-the-smith-decomposition-to-analyze-a-lattice/O_84.png)
の行によって生成された格子を可視化する.
In[10]:=
![Click for copyable input](assets.ja/use-the-smith-decomposition-to-analyze-a-lattice/In_101.png)
ptsg = Flatten[
Table[j First[g] + k Last[g], {j, -12, 12}, {k, -12, 12}], 1];
In[11]:=
![Click for copyable input](assets.ja/use-the-smith-decomposition-to-analyze-a-lattice/In_102.png)
graphicsg =
Graphics[{Red, PointSize[Medium], Point@ptsg}, PlotRange -> 10,
Axes -> True]
Out[11]=
![](assets.ja/use-the-smith-decomposition-to-analyze-a-lattice/O_85.png)
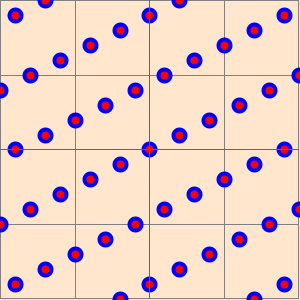
新しい格子をもとの格子に重ねると,両方同じであることが確認できる.
In[12]:=
![Click for copyable input](assets.ja/use-the-smith-decomposition-to-analyze-a-lattice/In_103.png)
Show[{graphicsb, graphicsg}]
Out[12]=
![](assets.ja/use-the-smith-decomposition-to-analyze-a-lattice/O_86.png)