Dataset as an Annotation
Dataset objects can be used directly as an annotation of EntityValue.
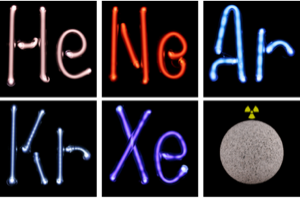
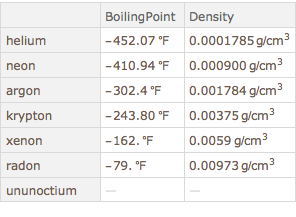
Construct a dataset of properties of noble gases.
In[1]:=
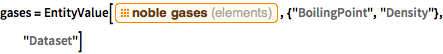
gases = EntityValue[
  EntityClass["Element", "NobleGas"], {"BoilingPoint", "Density"},
  "Dataset"]
Out[1]=
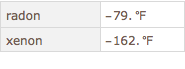
Find the two atoms with the highest boiling point temperature.
In[2]:=
gases[TakeLargest[2], "BoilingPoint"]Out[2]=
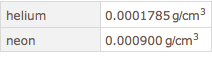
Find the two atoms with the smallest density.
In[3]:=
gases[TakeSmallest[2], "Density"]Out[3]=
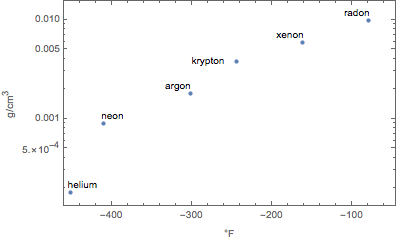
Visualize on a two-dimensional plot the density and boiling point of each noble gas.
In[4]:=
ListLogPlot[gases, Frame -> True, FrameLabel -> Automatic]Out[4]=