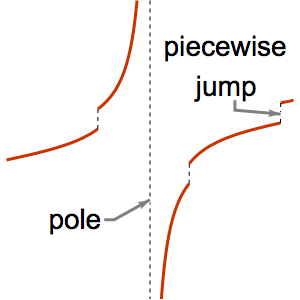
Обнаружение и удаление особых точек
Полюс  при
при  автоматически определяется и удаляется при построении графика.
In[1]:=
Plot[1/x, {x, -3, 3}, ImageSize -> 400, PlotTheme -> "Frame"]Out[1]=

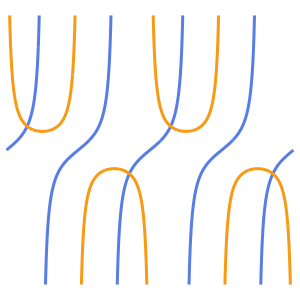
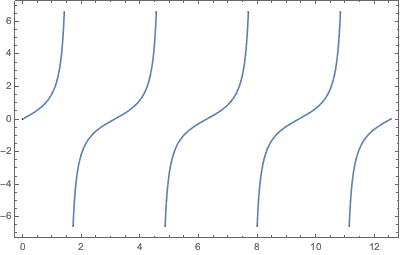
То же самое происходит для полюсов Tan[x].
In[2]:=
Plot[Tan[x], {x, 0, 4 Pi}, ImageSize -> 400, PlotTheme -> "Frame"]Out[2]=
Покажите асимптоты, соответствующие полюсам.
In[3]:=
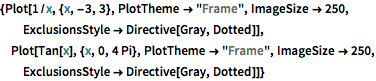
{Plot[1/x, {x, -3, 3}, PlotTheme -> "Frame", ImageSize -> 250,
  ExclusionsStyle -> Directive[Gray, Dotted]],
 Plot[Tan[x], {x, 0, 4 Pi}, PlotTheme -> "Frame", ImageSize -> 250,
  ExclusionsStyle -> Directive[Gray, Dotted]]}
Out[3]=