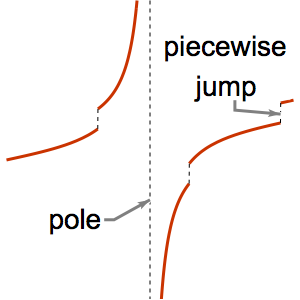
检测和移除奇点
绘图时自动识别并移除 ![]() 在
在  处的极点.
处的极点.
In[1]:=
Plot[1/x, {x, -3, 3}, ImageSize -> 400, PlotTheme -> "Frame"]Out[1]=

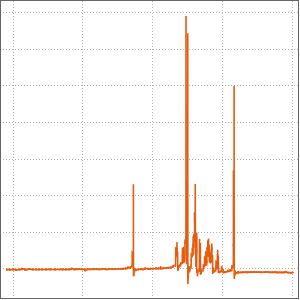
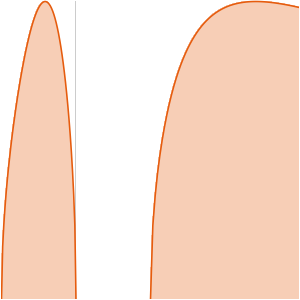
Tan[x] 的极点也一样.
In[2]:=
Plot[Tan[x], {x, 0, 4 Pi}, ImageSize -> 400, PlotTheme -> "Frame"]Out[2]=

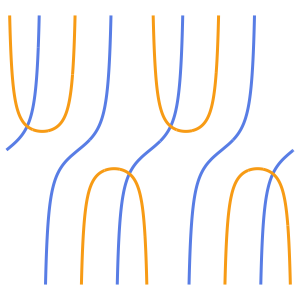
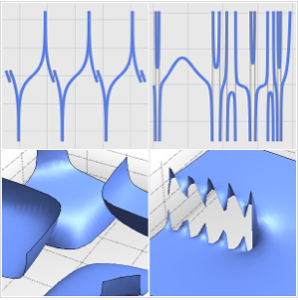
显示与极点对应的渐近线.
In[3]:=
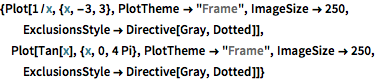
{Plot[1/x, {x, -3, 3}, PlotTheme -> "Frame", ImageSize -> 250,
  ExclusionsStyle -> Directive[Gray, Dotted]],
 Plot[Tan[x], {x, 0, 4 Pi}, PlotTheme -> "Frame", ImageSize -> 250,
  ExclusionsStyle -> Directive[Gray, Dotted]]}
Out[3]=