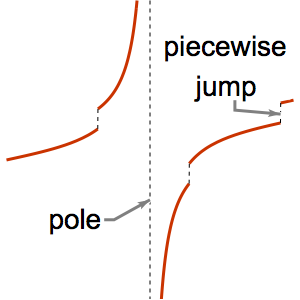
Detect and Remove Singular Points
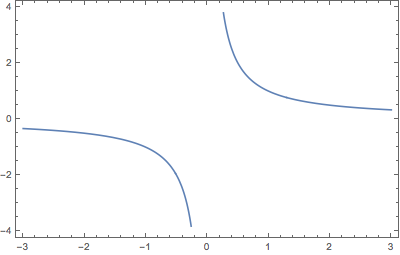
The pole of  at
at  is automatically identified and removed when plotting.
In[1]:=
Plot[1/x, {x, -3, 3}, ImageSize -> 400, PlotTheme -> "Frame"]Out[1]=
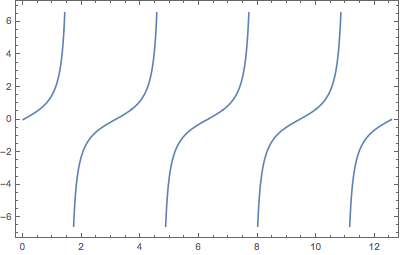
Likewise for the poles of Tan[x].
In[2]:=
Plot[Tan[x], {x, 0, 4 Pi}, ImageSize -> 400, PlotTheme -> "Frame"]Out[2]=
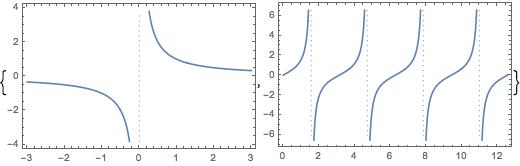
Show the asymptotes corresponding to the poles.
In[3]:=
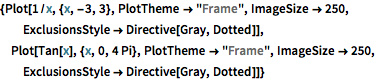
{Plot[1/x, {x, -3, 3}, PlotTheme -> "Frame", ImageSize -> 250,
  ExclusionsStyle -> Directive[Gray, Dotted]],
 Plot[Tan[x], {x, 0, 4 Pi}, PlotTheme -> "Frame", ImageSize -> 250,
  ExclusionsStyle -> Directive[Gray, Dotted]]}
Out[3]=