Plot Temperature vs. Size
Here are the atomic masses and melting points of the elements as an array of values with associated units.
In[1]:=
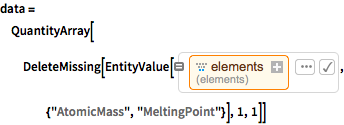
data = QuantityArray[DeleteMissing[EntityValue[\!\(\*
NamespaceBox["LinguisticAssistant",
DynamicModuleBox[{Typeset`query$$ = "elements", Typeset`boxes$$ =
        InterpretationBox[
DynamicModuleBox[{EntityFramework`Formatting`Private`open = False},
TemplateBox[{
TemplateBox[{"\"elements\""}, "ImplicitEntityClassBase"],
InterpretationBox[
TagBox[
GridBox[{{""}}, GridBoxAlignment -> {"Columns" -> {{Left}}},
               DefaultBaseStyle -> "GeneralizedEntityInfoGrid",
               GridBoxItemSize -> {
                "Columns" -> {{Automatic}}, "Rows" -> {{Automatic}}}],
               "Column"],
Column[{}, DefaultBaseStyle -> "GeneralizedEntityInfoGrid"]],
Dynamic[EntityFramework`Formatting`Private`open],
            "\"EntityClass[\\\"Element\\\", All]\"",
TemplateBox[{"\"(\"", "\"elements\"", "\")\""}, "RowDefault"]},
           "ImplicitEntityToggleLabeled"]],
EntityClass["Element", All], SelectWithContents -> True],
        Typeset`allassumptions$$ = {{
         "type" -> "Clash", "word" -> "elements",

          "template" -> "Assuming \"${word}\" is ${desc1}. Use as \
${desc2} instead", "count" -> "5",
          "Values" -> {{
            "name" -> "ElementClass", "desc" -> "a class of elements",
              "input" -> "*C.elements-_*ElementClass-"}, {
            "name" -> "Book", "desc" -> "a book",
             "input" -> "*C.elements-_*Book-"}, {
            "name" -> "Periodical", "desc" -> "a periodical",
             "input" -> "*C.elements-_*Periodical-"}, {
            "name" -> "MathWorld",
             "desc" -> " referring to a mathematical definition",
             "input" -> "*C.elements-_*MathWorld-"}, {
            "name" -> "Word", "desc" -> "a word",
             "input" -> "*C.elements-_*Word-"}}}},
        Typeset`assumptions$$ = {}, Typeset`open$$ = {1, 2},
        Typeset`querystate$$ = {
        "Online" -> True, "Allowed" -> True,
         "mparse.jsp" -> 0.541814`6.185395216127775,
         "Messages" -> {}}},
DynamicBox[ToBoxes[
AlphaIntegration`LinguisticAssistantBoxes["", 4, Automatic,
Dynamic[Typeset`query$$],
Dynamic[Typeset`boxes$$],
Dynamic[Typeset`allassumptions$$],
Dynamic[Typeset`assumptions$$],
Dynamic[Typeset`open$$],
Dynamic[Typeset`querystate$$]], StandardForm],
ImageSizeCache->{166., {23., 20.}},
TrackedSymbols:>{
          Typeset`query$$, Typeset`boxes$$, Typeset`allassumptions$$,
           Typeset`assumptions$$, Typeset`open$$,
           Typeset`querystate$$}],
DynamicModuleValues:>{},
UndoTrackedVariables:>{Typeset`open$$}],
BaseStyle->{"Deploy"},
DeleteWithContents->True,
Editable->False,
SelectWithContents->True]\), {"AtomicMass", "MeltingPoint"}], 1, 1]]
Out[1]=
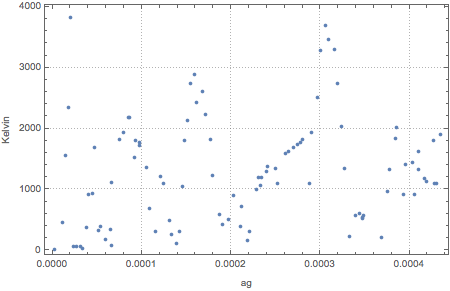
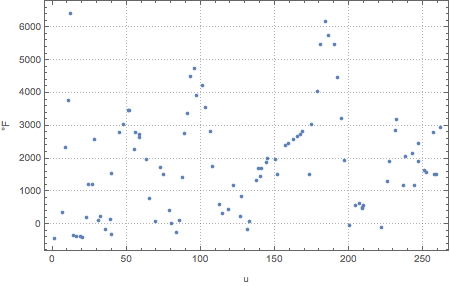
Plot the data and label the axes with the units.
In[2]:=
ListPlot[data, PlotTheme -> "Detailed", FrameLabel -> Automatic,
 ImageSize -> 450]
Out[2]=
Plot the data with attograms and kelvins as the desired units instead.
In[3]:=
ListPlot[data, PlotTheme -> "Detailed", FrameLabel -> Automatic,
 ImageSize -> 450, TargetUnits -> {"Attograms", "Kelvin"}]
Out[3]=
