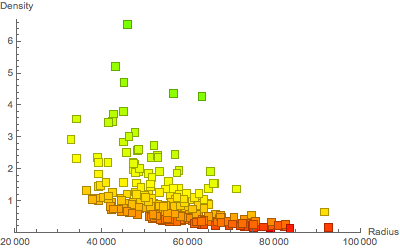
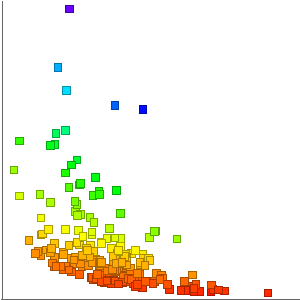
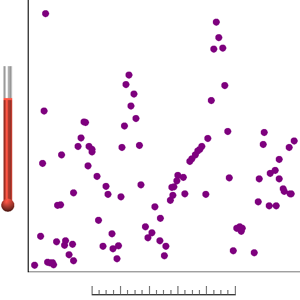
Use Anything as a Label
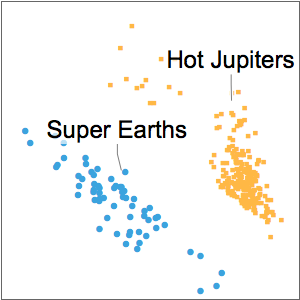
Use Hue in a LabelingFunction to represent a third quantity in 2D plots.
show complete Wolfram Language input
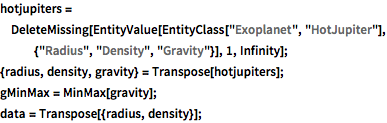
In[2]:=
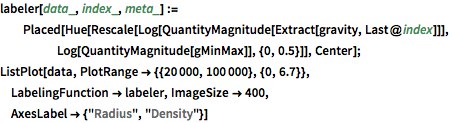
labeler[data_, index_, meta_] :=
  Placed[Hue[
    Rescale[Log[QuantityMagnitude[Extract[gravity, Last@index]]],
     Log[QuantityMagnitude[gMinMax]], {0, 0.5}]], Center];
ListPlot[data, PlotRange -> {{20000, 100000}, {0, 6.7}},
 LabelingFunction -> labeler, ImageSize -> 400,
 AxesLabel -> {"Radius", "Density"}]
Out[2]=