Styling Callouts
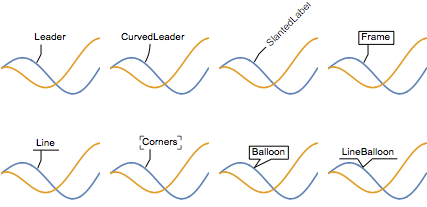
Use named appearances for callouts.
In[1]:=

Grid[Partition[Table[
   Plot[{Callout[Log[x] Sin[x], a, 3, Appearance -> a,
      CalloutStyle -> Black], Log[x] Cos[x]}, {x, 1, 2 Pi},
    PlotTheme -> "Minimal", ImageSize -> 100, Axes -> False,
    AspectRatio -> 1,
    PlotRange -> {{1, 2 Pi}, {-2, 4}}], {a, {"Leader", "CurvedLeader",
      "SlantedLabel", "Frame", "Line", "Corners", "Balloon",
     "LineBalloon"}}], 4, 4, 1, {}]]
Out[1]=
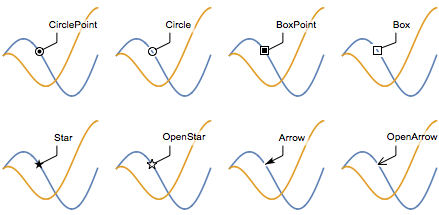
Connect callouts to their anchor points with built-in shapes.
In[2]:=
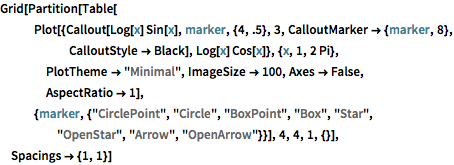
Grid[Partition[Table[
   Plot[{Callout[Log[x] Sin[x], marker, {4, .5}, 3,
      CalloutMarker -> {marker, 8}, CalloutStyle -> Black],
     Log[x] Cos[x]}, {x, 1, 2 Pi}, PlotTheme -> "Minimal",
    ImageSize -> 100, Axes -> False,
    AspectRatio -> 1], {marker, {"CirclePoint", "Circle", "BoxPoint",
     "Box", "Star", "OpenStar", "Arrow", "OpenArrow"}}], 4, 4, 1, {}],
  Spacings -> {1, 1}]
Out[2]=
