3D Chromaticity Diagram
The three-dimensional nature of many standard color models makes it a natural choice to display them in a three-dimensional space. Use ChromaticityPlot3D to create a 3D plot in one of the many supported reference spaces.
Visualize and compare 3D gamuts of multiple color spaces.
| In[1]:= | X |
| Out[1]= | 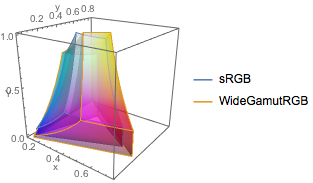 |
Visualize color distributions in 3D.
| In[2]:= | X |
| Out[2]= | 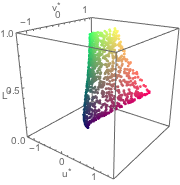 |
Visualize a custom color profile.
| In[3]:= | 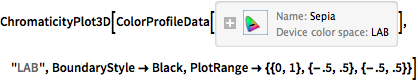 X |
| Out[3]= | 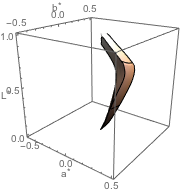 |