Visualize the Pixel Distribution of an Image
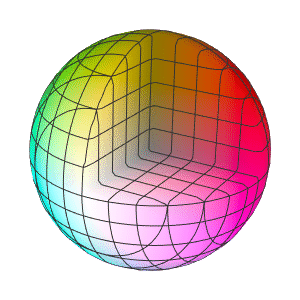
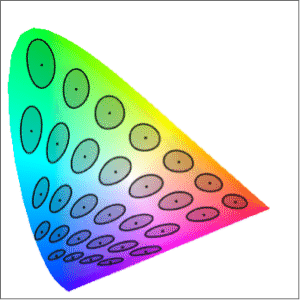
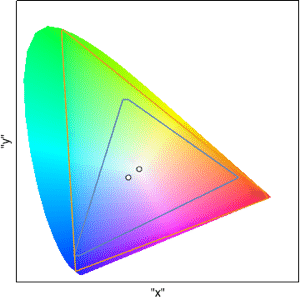
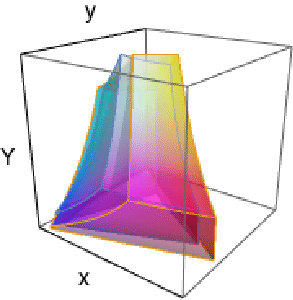
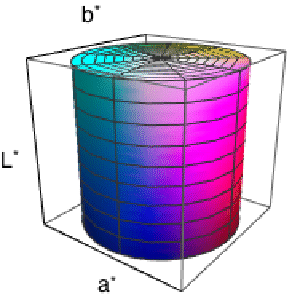
The distribution of the colors in an image is often an important and telling property. ChromaticityPlot and ChromaticityPlot3D can be used to display them in several 2D and 3D reference spaces.
Visualize the complete 3D and 2D distributions of the RGB values in an image.
| In[1]:= | X |
| Out[1]= |
| In[2]:= | X |
| Out[2]= |
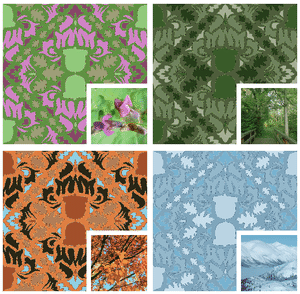
Plot the color distribution of images taken in different seasons.
| In[3]:= | X |
| Out[3]= |
