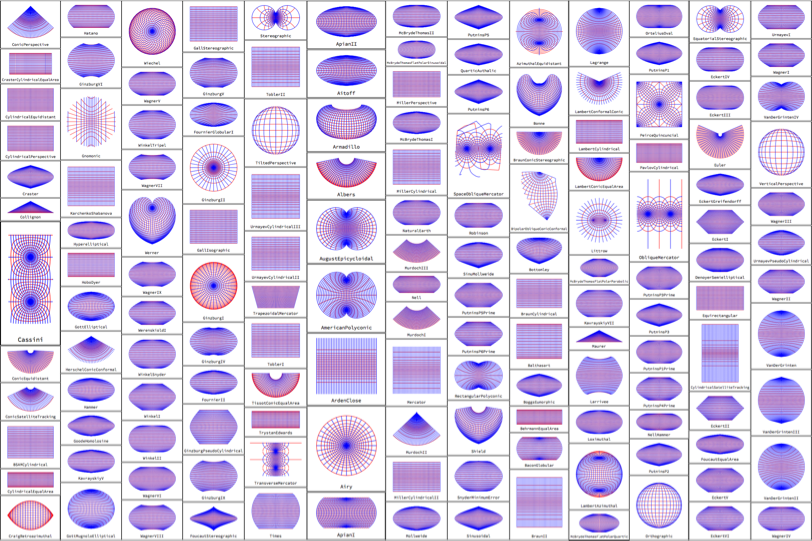
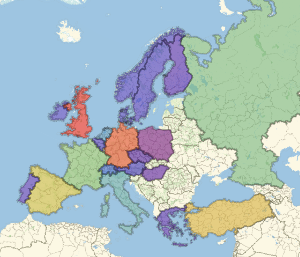
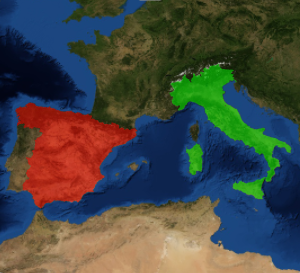
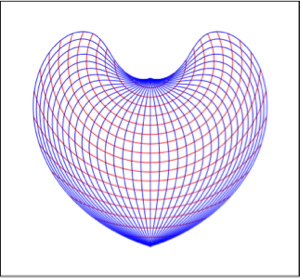
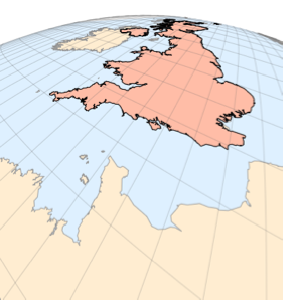
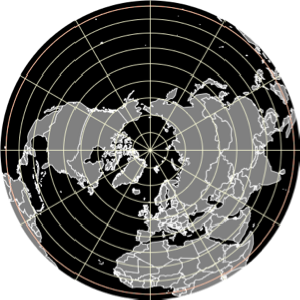
투영의 위선과 경선의 격자
이 함수는 지도 투영법으로 투영한 후 위선 및 경선에 의한 완전한 격자를 각각 빨간색과 파란색으로 그릴 수 있습니다.
In[1]:=
graticule[proj_] :=
With[{centering = {0, 0, 1.5},
diff = Quantity[10, "AngularDegrees"]},
Framed[Labeled[
GeoGraphics[GeoRange -> "World",
GeoProjection -> {proj, "Centering" -> centering},
GeoGridLines -> diff, GeoGridLinesStyle -> {Red, Blue},
GeoBackground -> None, PlotRangePadding -> Scaled[0.1]], proj]]
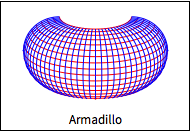
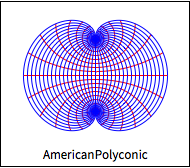
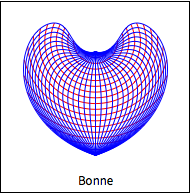
]다음의 세가지 예제를 살펴봅니다.
In[2]:=
graticule["Armadillo"]Out[2]=
In[3]:=
graticule["AmericanPolyconic"]Out[3]=
In[4]:=
graticule["Bonne"]Out[4]=
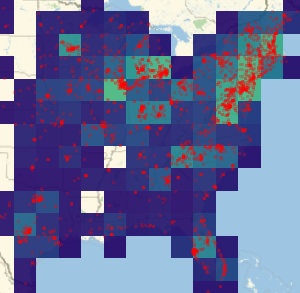
구형 모델 151개의 프로젝션에 관한 모든 위도 경도 격자를 계산합니다.
In[5]:=
plots = graticule /@ GeoProjectionData["Spherical"];충분히 작은 이미지 크기를 사용하여 그들을 래스터화합니다.
In[6]:=
images = Rasterize[#, ImageSize -> 200] & /@ plots;이미지 콜라주를 구축합니다.
In[7]:=
ImageCollage[images]Out[7]=