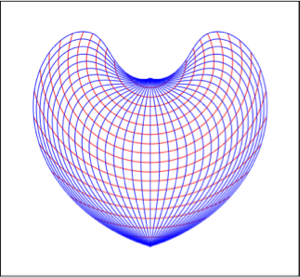
经线和纬线的投影网格
这个函数绘制纬线和经线(分别为红色和蓝色)在以一种地理投影法投影后的全部网格.
In[1]:=
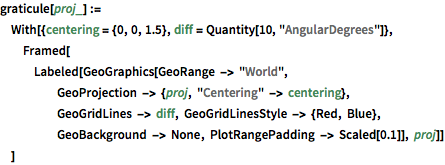
graticule[proj_] :=
With[{centering = {0, 0, 1.5},
diff = Quantity[10, "AngularDegrees"]},
Framed[Labeled[
GeoGraphics[GeoRange -> "World",
GeoProjection -> {proj, "Centering" -> centering},
GeoGridLines -> diff, GeoGridLinesStyle -> {Red, Blue},
GeoBackground -> None, PlotRangePadding -> Scaled[0.1]], proj]]
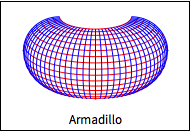
]下面是三个例子.
In[2]:=
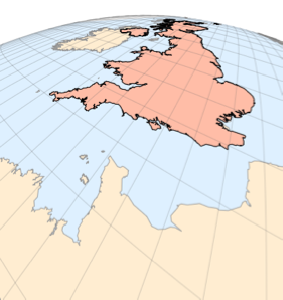
graticule["Armadillo"]Out[2]=
In[3]:=
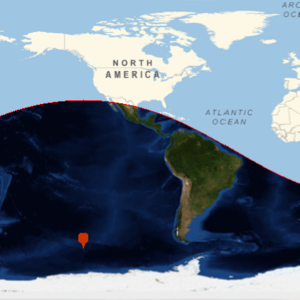
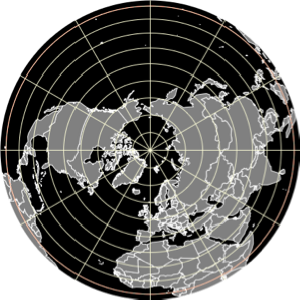
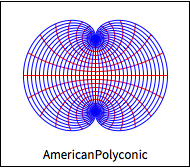
graticule["AmericanPolyconic"]Out[3]=
In[4]:=
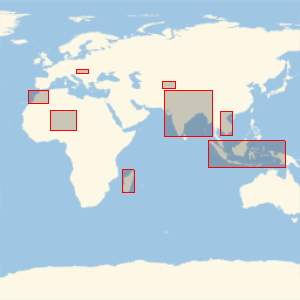
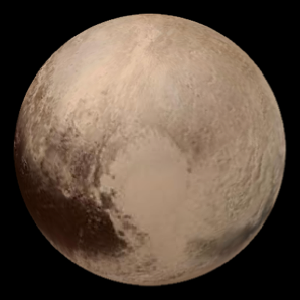
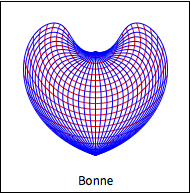
graticule["Bonne"]Out[4]=
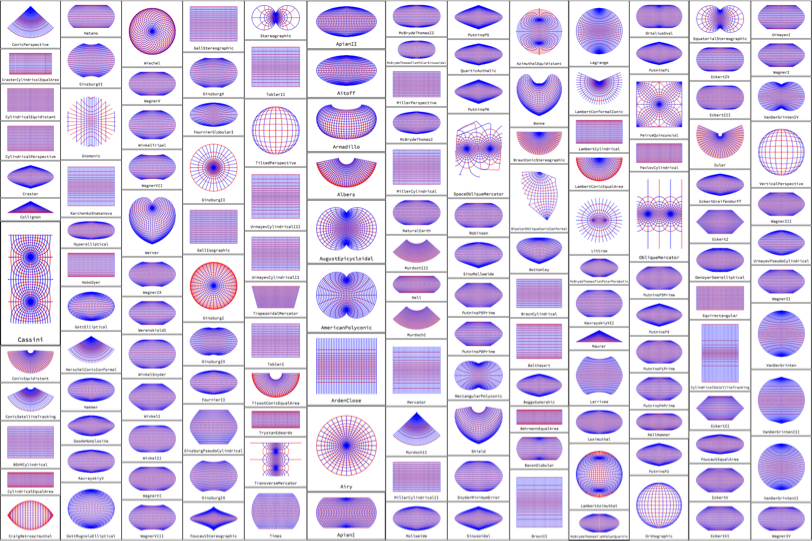
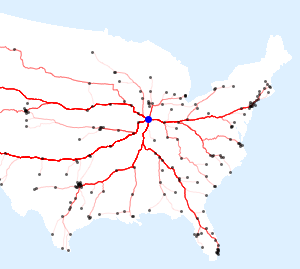
计算在球形参考模型下所有 151 种投影法下的经纬度网格.
In[5]:=
plots = graticule /@ GeoProjectionData["Spherical"];用足够小的图像尺寸对它们栅格化.
In[6]:=
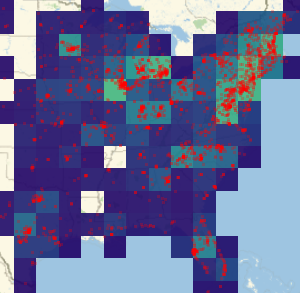
images = Rasterize[#, ImageSize -> 200] & /@ plots;构建一个图像拼贴画.
In[7]:=
ImageCollage[images]Out[7]=