投影法の緯線と経線の格子
この関数は,地図投影法で投影してから,緯線(赤)と経線(青)の完全な格子を描画する.
In[1]:=
graticule[proj_] :=
With[{centering = {0, 0, 1.5},
diff = Quantity[10, "AngularDegrees"]},
Framed[Labeled[
GeoGraphics[GeoRange -> "World",
GeoProjection -> {proj, "Centering" -> centering},
GeoGridLines -> diff, GeoGridLinesStyle -> {Red, Blue},
GeoBackground -> None, PlotRangePadding -> Scaled[0.1]], proj]]
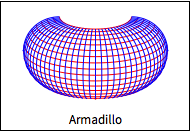
]以下に3つの例を挙げる.
In[2]:=
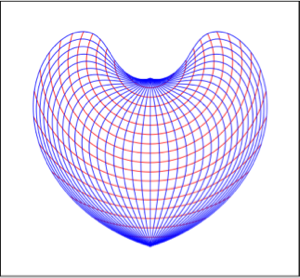
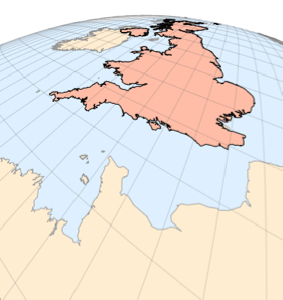
graticule["Armadillo"]Out[2]=
In[3]:=
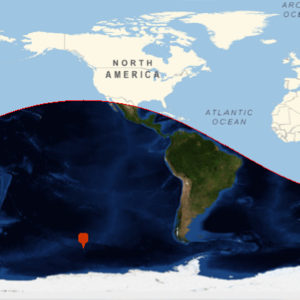
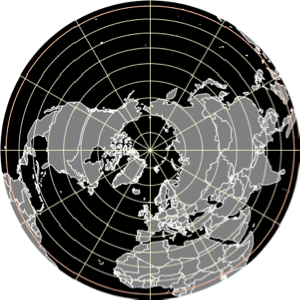
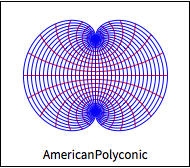
graticule["AmericanPolyconic"]Out[3]=
In[4]:=
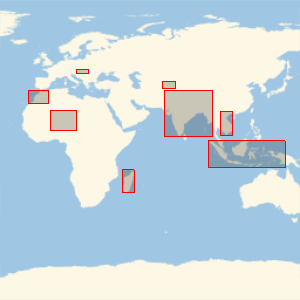
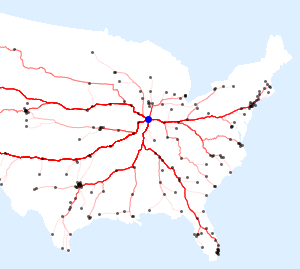
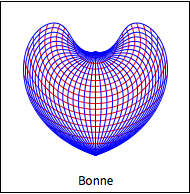
graticule["Bonne"]Out[4]=
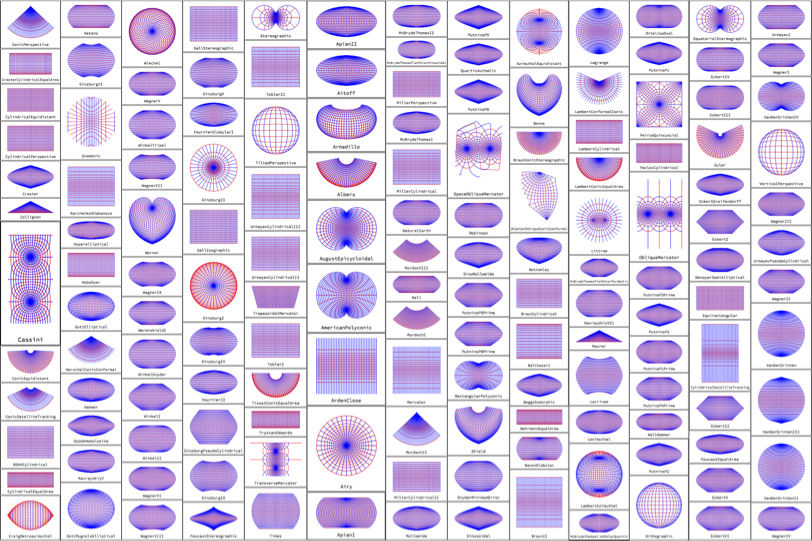
球体基準モデルの151の投影法すべてについて経緯度の格子を計算する.
In[5]:=
plots = graticule /@ GeoProjectionData["Spherical"];十分小さい画像サイズを使って,それらをラスタライズする.
In[6]:=
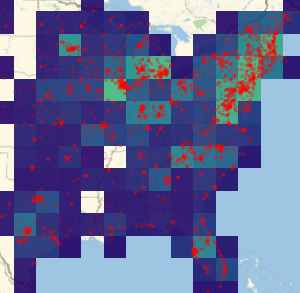
images = Rasterize[#, ImageSize -> 200] & /@ plots;画像のコラージュを構築する.
In[7]:=
ImageCollage[images]Out[7]=