Visualize the Stopping Power of Materials
Radiation particles lose kinetic energy when they travel through matter and eventually stop or get absorbed. This example explores the stopping power of substances when irradiated with alpha particles.
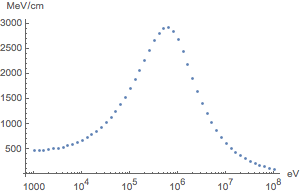
Plot the linear stopping power of biological tissue when irradiated with alpha particles of different impact energies. The vertical axis represents how much energy the particles lose on average per centimeter traveled.

ListLogLinearPlot[
 Table[{Quantity[10^x, "Electronvolts"],
   StoppingPowerData[
    "A150TissueEquivalentPlastic", {"Particle" ->
      Entity["Particle", "AlphaParticle"],
     "Energy" -> Quantity[10^x, "Electronvolts"]},
    "LinearStoppingPower"]}, {x, 3, 8, 0.1}], AxesLabel -> Automatic]
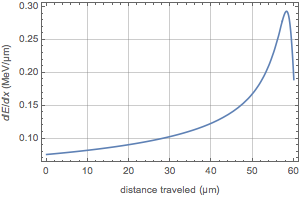
Now explore how linear stopping power changes for an alpha particle emitted from an atom of uranium as the particle travels through biological tissue. This is the initial kinetic energy of the particle.
initialKE =
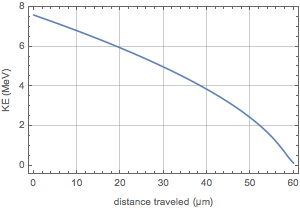
IsotopeData[Entity["Isotope", "Uranium235"], "BindingEnergy"]Represent the decrease in kinetic energy as the particle advances through the material until it stops at  approximately.

This represents the rate of loss of energy per unit of length.


