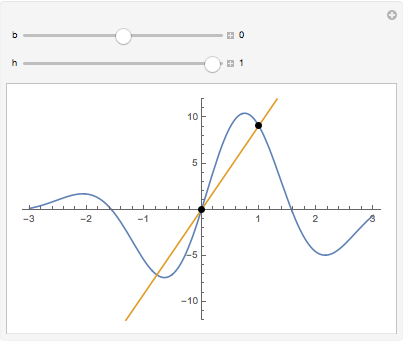
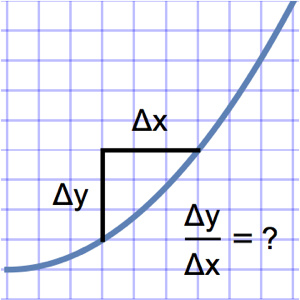
Visualize Secants and Tangents
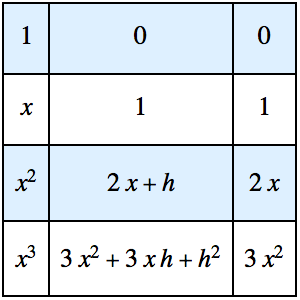
Use DifferenceQuotient to define the function  , the secant line between
  and
and  .
.
In[1]:=
f[x_] := 10 Exp[-((x^2 - x)/4)] Sin[2 x];In[2]:=
g[h_, b_][x_] =
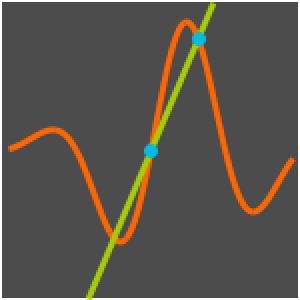
f[b] + (DifferenceQuotient[f[x], {x, h}] /. (x -> b)) (x - b);Visualize how the secant line changes as the base point is moved, but at every base point it approaches the tangent as  .
.
In[3]:=
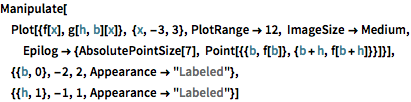
Manipulate[
 Plot[{f[x], g[h, b][x]}, {x, -3, 3}, PlotRange -> 12,
  ImageSize -> Medium,
  Epilog -> {AbsolutePointSize[7],
    Point[{{b, f[b]}, {b + h, f[b + h]}}]}], {{b, 0}, -2, 2,
  Appearance -> "Labeled"}, {{h, 1}, -1, 1, Appearance -> "Labeled"}]