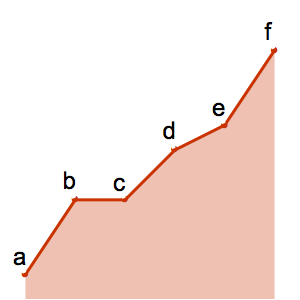
在函数域上绘制图形
以符号形式确认函数域并在其上绘图.
In[1]:=
f = Sqrt[x^3 - x]/(x^2 + 1)Out[1]=
In[2]:=
domain = With[{f = f}, ImplicitRegion[FunctionDomain[{f}, x], x]]Out[2]=
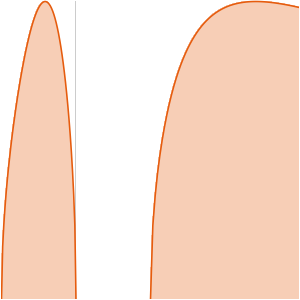
In[3]:=
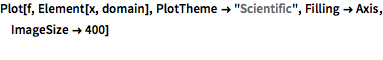
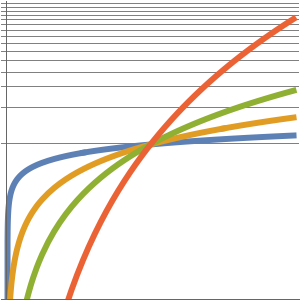
Plot[f, Element[x, domain], PlotTheme -> "Scientific",
 Filling -> Axis, ImageSize -> 400]
Out[3]=