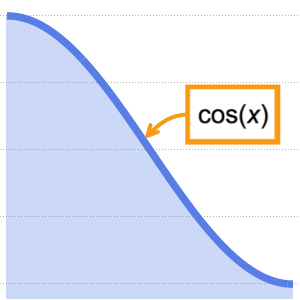
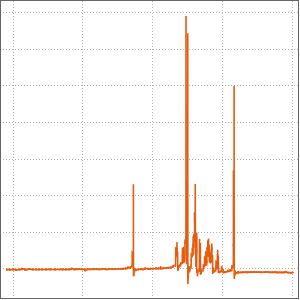
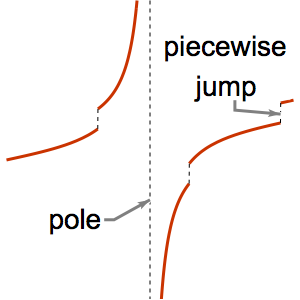
指定标签位置
可以用 x 和 y 坐标给出标注 (callout) 的位置和锚定点.
In[1]:=
LogPlot[{Callout[x^(Log[x] Sin[x]), x^(Log[x] Sin[x]), {3, 3}, 2.5],
  x^(Log[x] Cos[x]), x^(Log[x/2] Sin[2 x])}, {x, 1, 6},
 PlotTheme -> "Web"]
Out[1]=

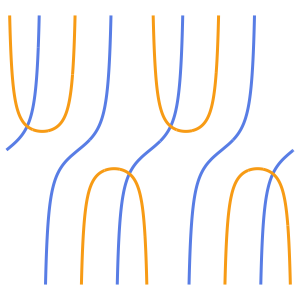
可以为 Labeled 给出 x 坐标和相对位置.
In[2]:=
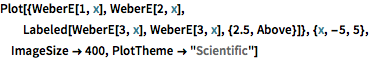
Plot[{WeberE[1, x], WeberE[2, x],
  Labeled[WeberE[3, x], WeberE[3, x], {2.5, Above}]}, {x, -5, 5},
 ImageSize -> 400, PlotTheme -> "Scientific"]
Out[2]=