| 22 | Machine Learning |
So far in this book, when we’ve wanted the Wolfram Language to do something, we’ve written code to tell it exactly what to do. But the Wolfram Language is also set up to be able to learn what to do just by looking at examples, using the idea of machine learning.
We’ll talk about how to train the language yourself. But first let’s look at some built-in functions that have already been trained on huge numbers of examples.
| In[1]:= |
| Out[1]= |
The Wolfram Language can also do the considerably more difficult “artificial intelligence” task of identifying what an image is of.
| In[2]:= | 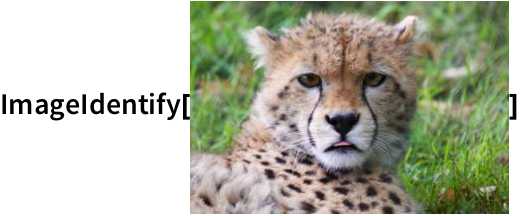
|
| Out[2]= |
There’s a general function Classify, which has been taught various kinds of classification. One example is classifying the “sentiment” of text.
| In[3]:= |
| Out[3]= |
Downbeat text is classified as having negative sentiment:
| In[4]:= |
| Out[4]= |
You can also train Classify yourself. Here’s a simple example of classifying handwritten digits as 0 or 1. You give Classify a collection of training examples, followed by a particular handwritten digit. Then it’ll tell you whether the digit you give is a 0 or 1.
With training examples, Classify correctly identifies a handwritten 0:
| In[5]:= | 
|
| Out[5]= |
To get some sense of how this works—and because it’s useful in its own right—let’s talk about the function Nearest, that finds what element in a list is nearest to what you supply.
Find what number in the list is nearest to 22:
| In[6]:= |
| Out[6]= |
Find the nearest three numbers:
| In[7]:= |
| Out[7]= |
Nearest can find nearest colors as well.
Find the 3 colors in the list that are nearest to the color you give:
| In[8]:= |
| Out[8]= |
| In[9]:= |
| Out[9]= |
There’s a notion of nearness for images too. And though it’s far from the whole story, this is effectively part of what ImageIdentify is using.
Something that’s again related is recognizing text (optical character recognition or OCR). Let’s make a piece of text that’s blurred.
| In[10]:= |
| Out[10]= |
TextRecognize can still recognize the original text string in this.
Recognize text in the image:
| In[11]:= |
| Out[11]= |
Generate a sequence of progressively more blurred pieces of text:
| In[12]:= |
| Out[12]= |
As the text gets more blurred, TextRecognize makes a mistake, then gives up altogether:
| In[13]:= |
| Out[13]= |
Something similar happens if we progressively blur the picture of a cheetah. When the picture is still fairly sharp, ImageIdentify will correctly identify it as a cheetah. But when it gets too blurred ImageIdentify starts thinking it’s more likely to be a lion, and eventually the best guess is that it’s a picture of a person.
Progressively blur a picture of a cheetah:
| In[14]:= | 
|
| Out[14]= | 
|
When the picture gets too blurred, ImageIdentify no longer thinks it’s a cheetah:
| In[15]:= | 
|
| Out[15]= | 
|
ImageIdentify normally just gives what it thinks is the most likely identification. You can tell it, though, to give a list of possible identifications, starting from the most likely. Here are the top 10 possible identifications, in all categories.
ImageIdentify thinks this might be a cheetah, but it’s more likely to be a lion, or it could be a dog:
| In[16]:= | 
|
| Out[16]= | 
|
When the image is sufficiently blurred, ImageIdentify can have wild ideas about what it might be:
| In[17]:= | 
|
| Out[17]= | 
|
In machine learning, one often gives training that explicitly says, for example, “this is a cheetah”, “this is a lion”. But one also often just wants to automatically pick out categories of things without any specific training.
One way to start doing this is to take a collection of things—say colors—and then to find clusters of similar ones. This can be achieved using FindClusters.
Collect “clusters” of similar colors into separate lists:
| In[18]:= |
| Out[18]= |
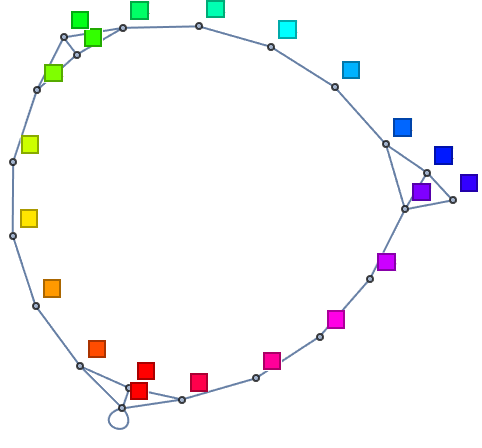
You can get a different view by connecting each color to the three most similar colors in the list, then making a graph out of the connections. In the particular example here, there end up being three disconnected subgraphs.
| In[19]:= |
| Out[19]= | 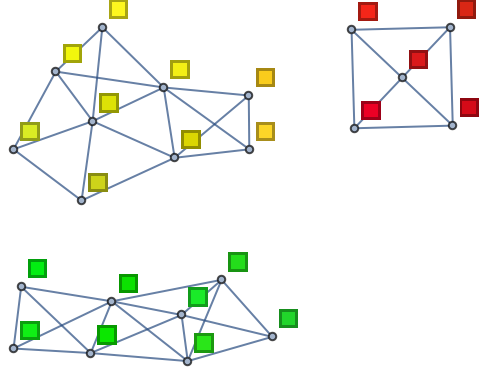
|
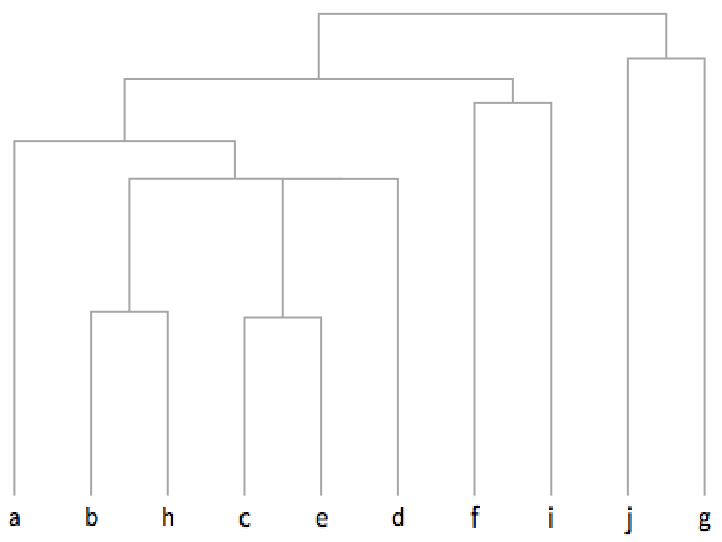
Show nearby colors successively grouped together:
| In[20]:= |
| Out[20]= | 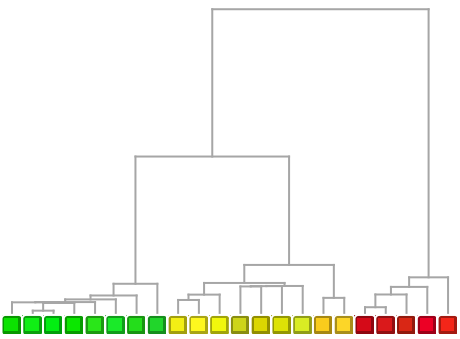
|
When we compare things—whether they’re colors or pictures of animals—we can think of identifying certain features that allow us to distinguish them. For colors, a feature might be how light the color is, or how much red it contains. For pictures of animals, a feature might be how furry the animal looks, or how pointy its ears are.
In the Wolfram Language, FeatureSpacePlot takes collections of objects and tries to find what it considers the “best” distinguishing features of them, then uses the values of these to position objects in a plot.
FeatureSpacePlot doesn’t explicitly say what features it’s using—and actually they’re usually quite hard to describe. But what happens in the end is that FeatureSpacePlot arranges things so that objects that have similar features are drawn nearby.
FeatureSpacePlot makes similar colors be placed nearby:
| In[21]:= |
| Out[21]= | 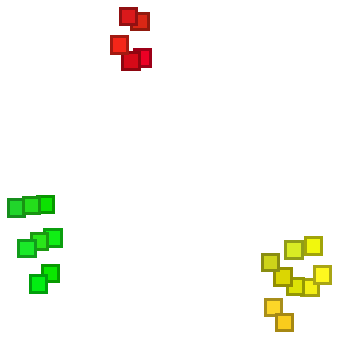
|
If one uses, say, 100 colors picked completely at random, then FeatureSpacePlot will again place colors it considers similar nearby.
100 random colors laid out by FeatureSpacePlot:
| In[22]:= |
| Out[22]= | 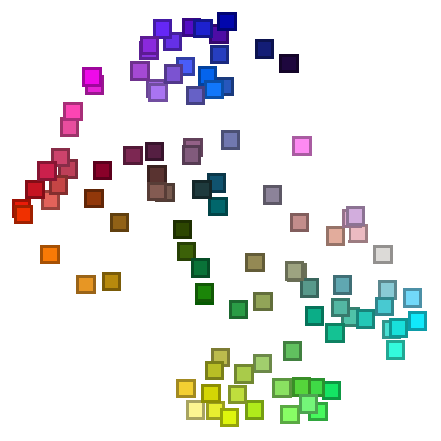
|
Let’s try the same kind of thing with images of letters.
Make a rasterized image of each letter in the alphabet:
| In[23]:= |
| Out[23]= |
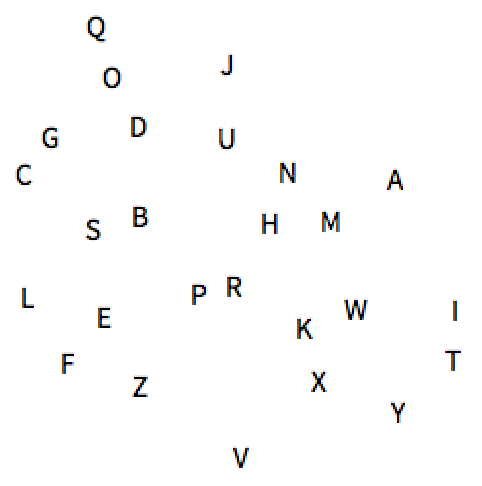
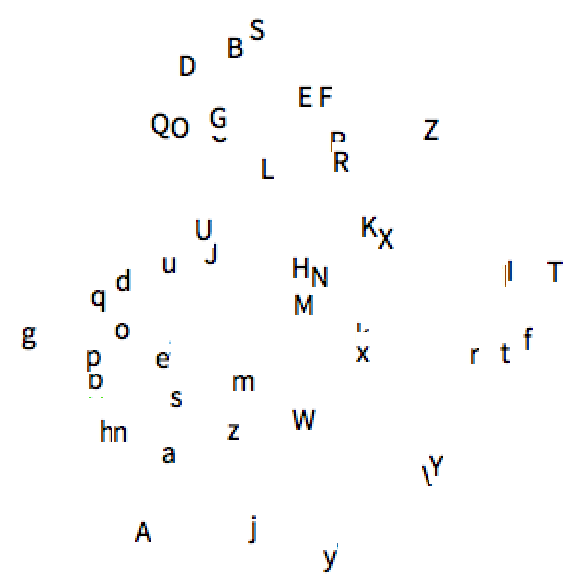
FeatureSpacePlot will use visual features of these images to lay them out. The result is that letters that look similar—like y and v or e and c—will wind up nearby.
| In[24]:= |
| Out[24]= | 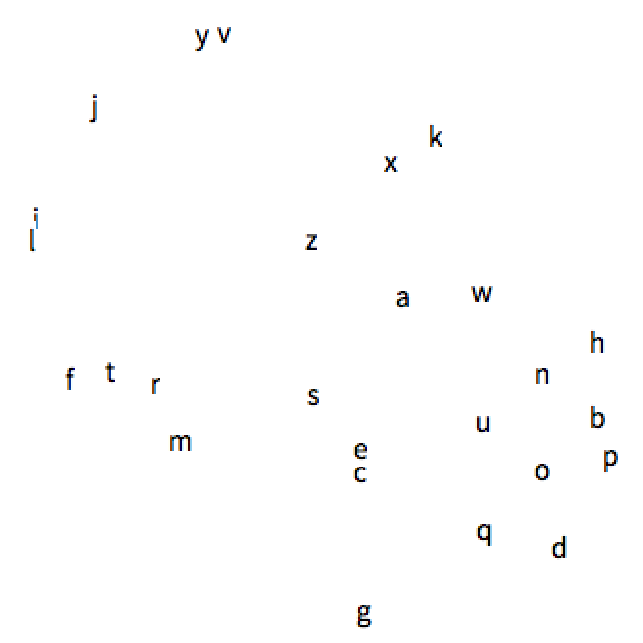
|
Here’s the same thing, but now with pictures of cats, cars and chairs. FeatureSpacePlot immediately separates the different kinds of things.
FeatureSpacePlot places photographs of different kinds of things quite far apart:
| In[25]:= | 
|
| Out[25]= | 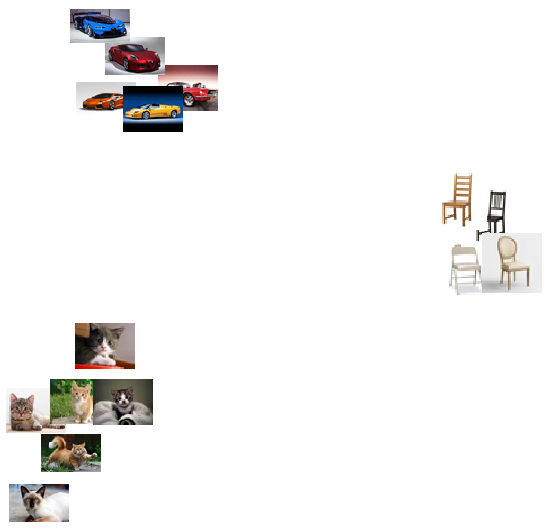
|
| LanguageIdentify[text] | identify what human language text is in | |
| ImageIdentify[image] | identify what an image is of | |
| TextRecognize[text] | recognize text from an image (OCR) | |
| Classify[training,data] | classify data on the basis of training examples | |
| Nearest[list,item] | find what element of list is nearest to item | |
| FindClusters[list] | find clusters of similar items | |
| NearestNeighborGraph[list,n] | connect elements of list to their n nearest neighbors | |
| Dendrogram[list] | make a hierarchical tree of relations between items | |
| FeatureSpacePlot[list] | plot elements of list in an inferred “feature space” |
22.3Make a table of image identifications for an image of a tiger, blurred by an amount from 1 to 5. »
22.6Generate 20 random numbers up to 1000 and find which 3 are nearest to 100. »
22.8Of the first 100 squares, find the one nearest to 2000. »
22.9Find the 3 European flags nearest to the flag of Brazil. »
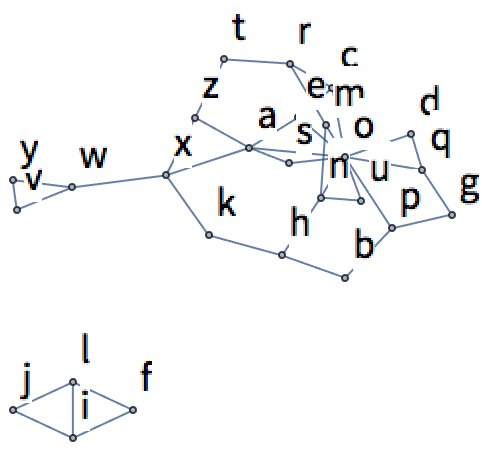
22.11Generate a list of 100 random numbers from 0 to 100, and make a graph of the 2 nearest neighbors of each one. »
22.12Collect the flags of Asia into clusters of similar flags. »
22.13Make raster images of the letters of the alphabet at size 20, then make a graph of the 2 nearest neighbors of each one. »
22.14Generate a table of the results of using TextRecognize on “hello” rasterized at size 50 and then blurred by between 1 and 10. »
22.15Make a dendrogram for images of the first 10 letters of the alphabet. »
22.16Make a feature space plot for the uppercase letters of the alphabet. »
+22.1Make a table of image identifications for a picture of the Eiffel Tower, blurred by an amount from 1 to 5. »
+22.5Generate a list of 10 random numbers from 0 to 10, and make a graph of the 3 nearest neighbors of each one. »
+22.6Find clusters of similar colors in a list of 100 random colors. »
+22.7Make a feature space plot for both upper and lowercase letters of the alphabet. »
How come I’m getting different results from the ones shown here?
Probably because Wolfram Language machine learning functions are continually getting more training—and so their results may change, hopefully always getting better. For TextRecognize, the results can depend in detail on the fonts used, and exactly how they’re rendered and rasterized on your computer.
How does ImageIdentify work inside?
It’s based on artificial neural networks inspired by the way brains seem to work. It’s been trained with millions of example images, from which it’s progressively learned to make distinctions. And a bit like in the game of “twenty questions”, by using enough of these distinctions it can eventually determine what an image is of.
How many kinds of things can ImageIdentify recognize?
At least 10,000—which is more than a typical human. (There are about 5000 “picturable nouns” in English.)
What makes ImageIdentify give a wrong answer?
A common cause is that what it’s asked about isn’t close enough to anything it’s been trained on. This can happen if something is in an unusual configuration or environment (for example, if a boat is not on a bluish background). ImageIdentify usually tries to find some kind of match, and the mistakes it makes often seem very “humanlike”.
Can I ask ImageIdentify the probabilities it assigns to different identifications?
Yes. For example, to find the probabilities for the top 10 identifications in all categories use ImageIdentify[image, All, 10, "Probability"].
How many examples does Classify typically need to work well?
If the general area (like everyday images) is one it already knows well, then as few as a hundred. But in areas that are new, it can take many millions of examples to achieve good results.
How does Nearest figure out a distance between colors?
It uses the function ColorDistance, which is based on a model of human color vision.
How does Nearest determine nearby words?
By looking at those at the smallest EditDistance, that is, reached by the smallest number of single-letter insertions, deletions and substitutions.
Absolutely. An example is the last graph in this section.
What features does FeatureSpacePlot use?
There’s no easy answer. When it’s given a collection of things, it’ll learn features that distinguish them—though it’s typically primed by having seen many other things of the same general type (like images).
- The Wolfram Language stores its latest machine learning classifiers in the cloud—but if you’re using a desktop system, they’ll automatically be downloaded, and then they’ll run locally.
- BarcodeImage and BarcodeRecognize work with bar codes and QR codes instead of pure text.
- ImageIdentify is the core of what the imageidentify.com website does.
- If you just give Classify training examples, it’ll produce a ClassifierFunction that can later be applied to many different pieces of data. This is pretty much always how Classify is used in practice.
- You can get a large standard training set of handwritten digits using ResourceData["MNIST"].
- Classify automatically picks between methods such as logistic regression, naive Bayes, random forests and support vector machines, as well as neural networks.
- FindClusters does unsupervised machine learning, where the computer just looks at data without being told anything about it. Classify does supervised machine learning, being given a set of training examples.
- Dendrogram does hierarchical clustering, and can be used to reconstruct evolutionary trees in areas like bioinformatics and historical linguistics.
- FeatureSpacePlot does dimension reduction, taking data that’s represented by many parameters, and finding a good way to “project” these down so they can be plotted in 2D.
- Rasterize/@Alphabet[ ] is a better way to make a list of rasterized letters, but we won’t talk about /@ until Section 25.
- FeatureExtraction lets you get out the feature vectors used by FeatureSpacePlot.
- FeatureNearest is like Nearest except that it learns what should be considered near by looking at the actual data you give. It’s what you need to do something like build an image-search function.
- You can build and train your own neural nets in the Wolfram Language using functions like NetChain, NetGraph and NetTrain. NetModel gives access to prebuilt nets.


