Longest Increasing Subsequences
The number of permutations  of
of  elements in which the longest increasing subsequence is at most of length
  can be computed by averaging over
  , where
  are matrices drawn from CircularUnitaryMatrixDistribution of dimension
  .
.
In[1]:=
{k, n} = {6, 2};Define the matrix property distribution and calculate the mean.
In[2]:=
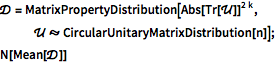
\[ScriptCapitalD] =
  MatrixPropertyDistribution[Abs[Tr[\[ScriptCapitalU]]]^(
   2 k), \[ScriptCapitalU] \[Distributed]
    CircularUnitaryMatrixDistribution[n]];
N[Mean[\[ScriptCapitalD]]]
Out[2]=
Compare with the direct count.
In[3]:=
Count[Permutations[Range[k]],
 perm_ /; Length[LongestOrderedSequence[perm]] <= n]
Out[3]=
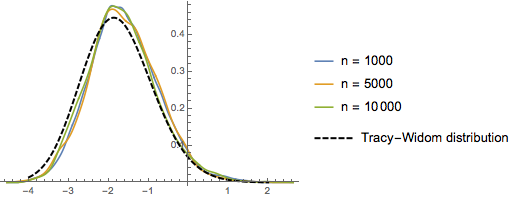
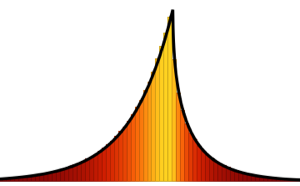
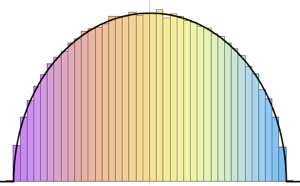
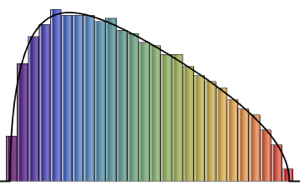
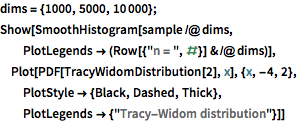
For  , the distribution of the scaled lengths of the longest increasing subsequences of random permutations converges to the Tracy–Widom distribution with
  .
.
In[4]:=
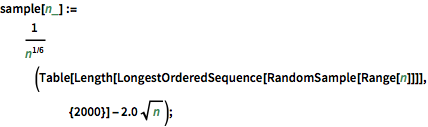
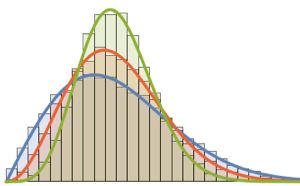
sample[n_] :=
  1/n^(1/6) (Table[
      Length[LongestOrderedSequence[
        RandomSample[Range[n]]]], {2000}] - 2.0 Sqrt[n]);
Compare the smooth histogram of sampled scaled lengths for increasing dimensions with the PDF of the Tracy–Widom distribution.
show complete Wolfram Language input
Out[5]=