Image Segmentation with Gaussian Mixture Model
Images are represented as arrays of pixels. A pixel is a scalar (or vector) that shows the intensity (or color). A Gaussian mixture model can be used to partition the pixels into similar segments for further analysis.
In[1]:=
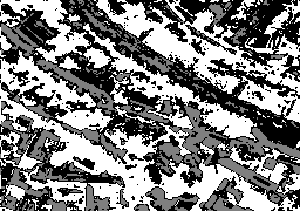
pic = ExampleData[{"TestImage", "Aerial"}]Out[1]=

In[2]:=
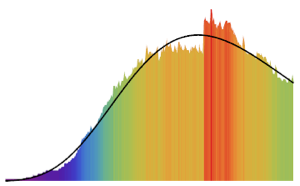
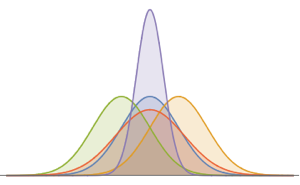
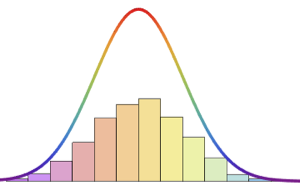
pixels = Flatten[ImageData[pic]];Visualize the distribution of pixel values.
show complete Wolfram Language input
Out[3]=

Fit the pixel values to a three-component Gaussian mixture model.
In[4]:=

gmm = Quiet@
   EstimatedDistribution[pixels,
    MixtureDistribution[{p1, p2, p3}, {NormalDistribution[a1, a2],
      NormalDistribution[b1, b2], NormalDistribution[c1, c2]}]];
Label each pixel with the most probable component with a maximum a posteriori probability (MAP) estimate.
In[5]:=

pxi = Table[PDF[dist, pixels], {dist, Last[gmm]}];
pxi = Transpose[pxi]/Total[pxi First[gmm]];
labels = ArrayReshape[Ordering[#, -1] & /@ pxi, ImageDimensions[pic]];
Visualize the segmented image, and compare it with the original one.
show complete Wolfram Language input
Out[6]=