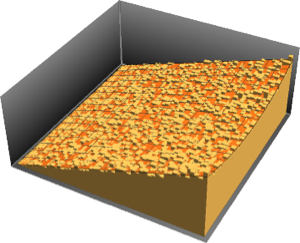
Sample from a Poisson Point Process
A Poisson point process is a generalization of the one-dimensional Poisson process to a multidimensional case. A homogeneous Poisson point process in geometric regions can be sampled by using RandomPoint.
Create a country polygon.
region = DiscretizeGraphics[CountryData["Mexico", "Polygon"],
  ImageSize -> Medium]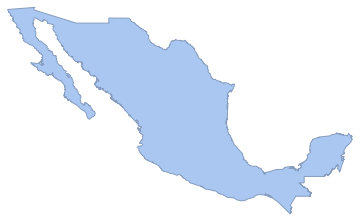
Define a function that does the sampling of the Poisson point process with three arguments: region, intensity, and number of realizations.
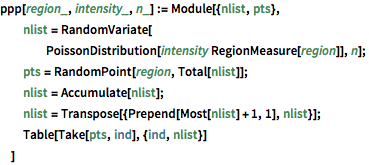
ppp[region_, intensity_, n_] := Module[{nlist, pts},
nlist =
RandomVariate[PoissonDistribution[intensity RegionMeasure[region]],
n];
pts = RandomPoint[region, Total[nlist]];
nlist = Accumulate[nlist];
nlist = Transpose[{Prepend[Most[nlist] + 1, 1], nlist}];
Table[Take[pts, ind], {ind, nlist}]
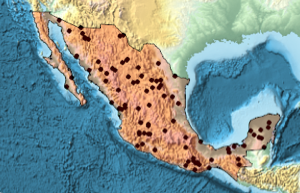
]Generate a realization of the Poisson point process in the country polygon with intensity 0.5 and visualize it with Graphics.
intensity = 0.5;
sample = ppp[region, intensity, 1];Show[region, Graphics[{Black, Point @@ sample}]]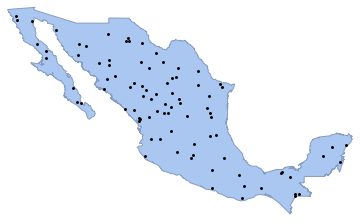
Generate 104 samples from the same process. The total number of points in each sample satisfies PoissonDistribution, with the mean equal to intensity times the area of the region.
samples = ppp[region, intensity, 10^4];
counts = Length /@ samples;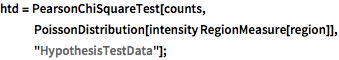
htd = PearsonChiSquareTest[counts,
   PoissonDistribution[intensity RegionMeasure[region]],
"HypothesisTestData"];htd["TestDataTable"]htd["TestConclusion"]The number of points in any subregion is also Poisson distributed. Here, this is examined with a disk that lies within the polygon, and the number of points in it is counted.
disk1 = Disk[{-107, 28}, 1.5];
Show[region, Graphics[{Red, disk1}]]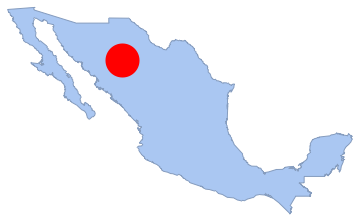
memberfun1 = RegionMember[disk1];
counts1 = Table[Total[Boole[memberfun1[pts]]], {pts, samples}];
Perform PearsonChiSquareTest on the number of counts with a Poisson distribution.
htd = PearsonChiSquareTest[counts1,
   PoissonDistribution[intensity RegionMeasure[disk1]],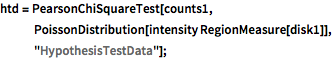
"HypothesisTestData"];htd["TestDataTable"]htd["TestConclusion"]The number of points in any disjoint subregions is independent. Here, the number of points in two disjoint disks is counted, and the SpearmanRankTest is performed.
disk2 = Disk[{-100, 20}, 1.3];
Show[region, Graphics[{Red, disk1, Blue, disk2}]]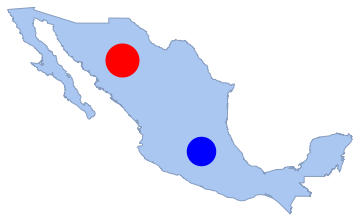
memberfun2 = RegionMember[disk2];
counts2 = Table[Total[Boole[memberfun2[pts]]], {pts, samples}];htd = SpearmanRankTest[counts1, counts2, "HypothesisTestData"];htd["TestDataTable"]htd["TestConclusion"]