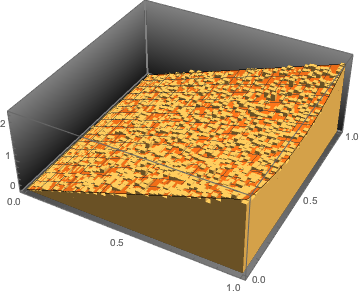
Sample from a Polynomial Density
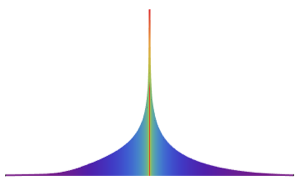
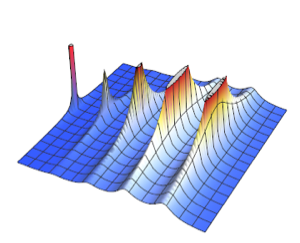
Define a multivariate formula distribution with a polynomial probability density function.
In[1]:=
dist = ProbabilityDistribution[ \[FormalX]1 (1 - \[FormalX]1 (1 - \
\[FormalX]2) \[FormalX]2), {\[FormalX]1, 0, 1}, {\[FormalX]2, 0, 1},
  Method -> "Normalize"]
Out[1]=
The density integrates to 1 in the given domain.
In[2]:=
Integrate[PDF[dist, {x, y}], {x, 0, 1}, {y, 0, 1}]Out[2]=
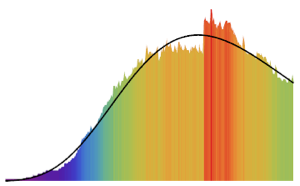
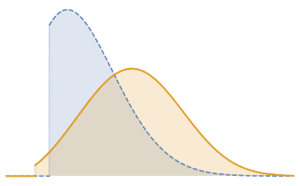
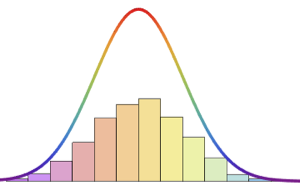
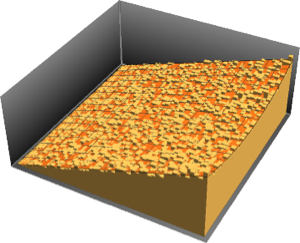
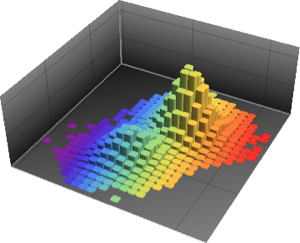
Sample from the distribution and compare the histogram with the density function.
show complete Wolfram Language input

Out[3]=